How it works
Every component.
The real product.
What each part of quantedGamma and quantedTicker is, what it is built from, how to read it and what its controls do — a short film each. Every picture is a real frame of the product.
SPX and VIX
quantedGamma
Licensed CBOE one-minute SPX and VIX data with market-maker positioning, recomputed every minute.
The reading order
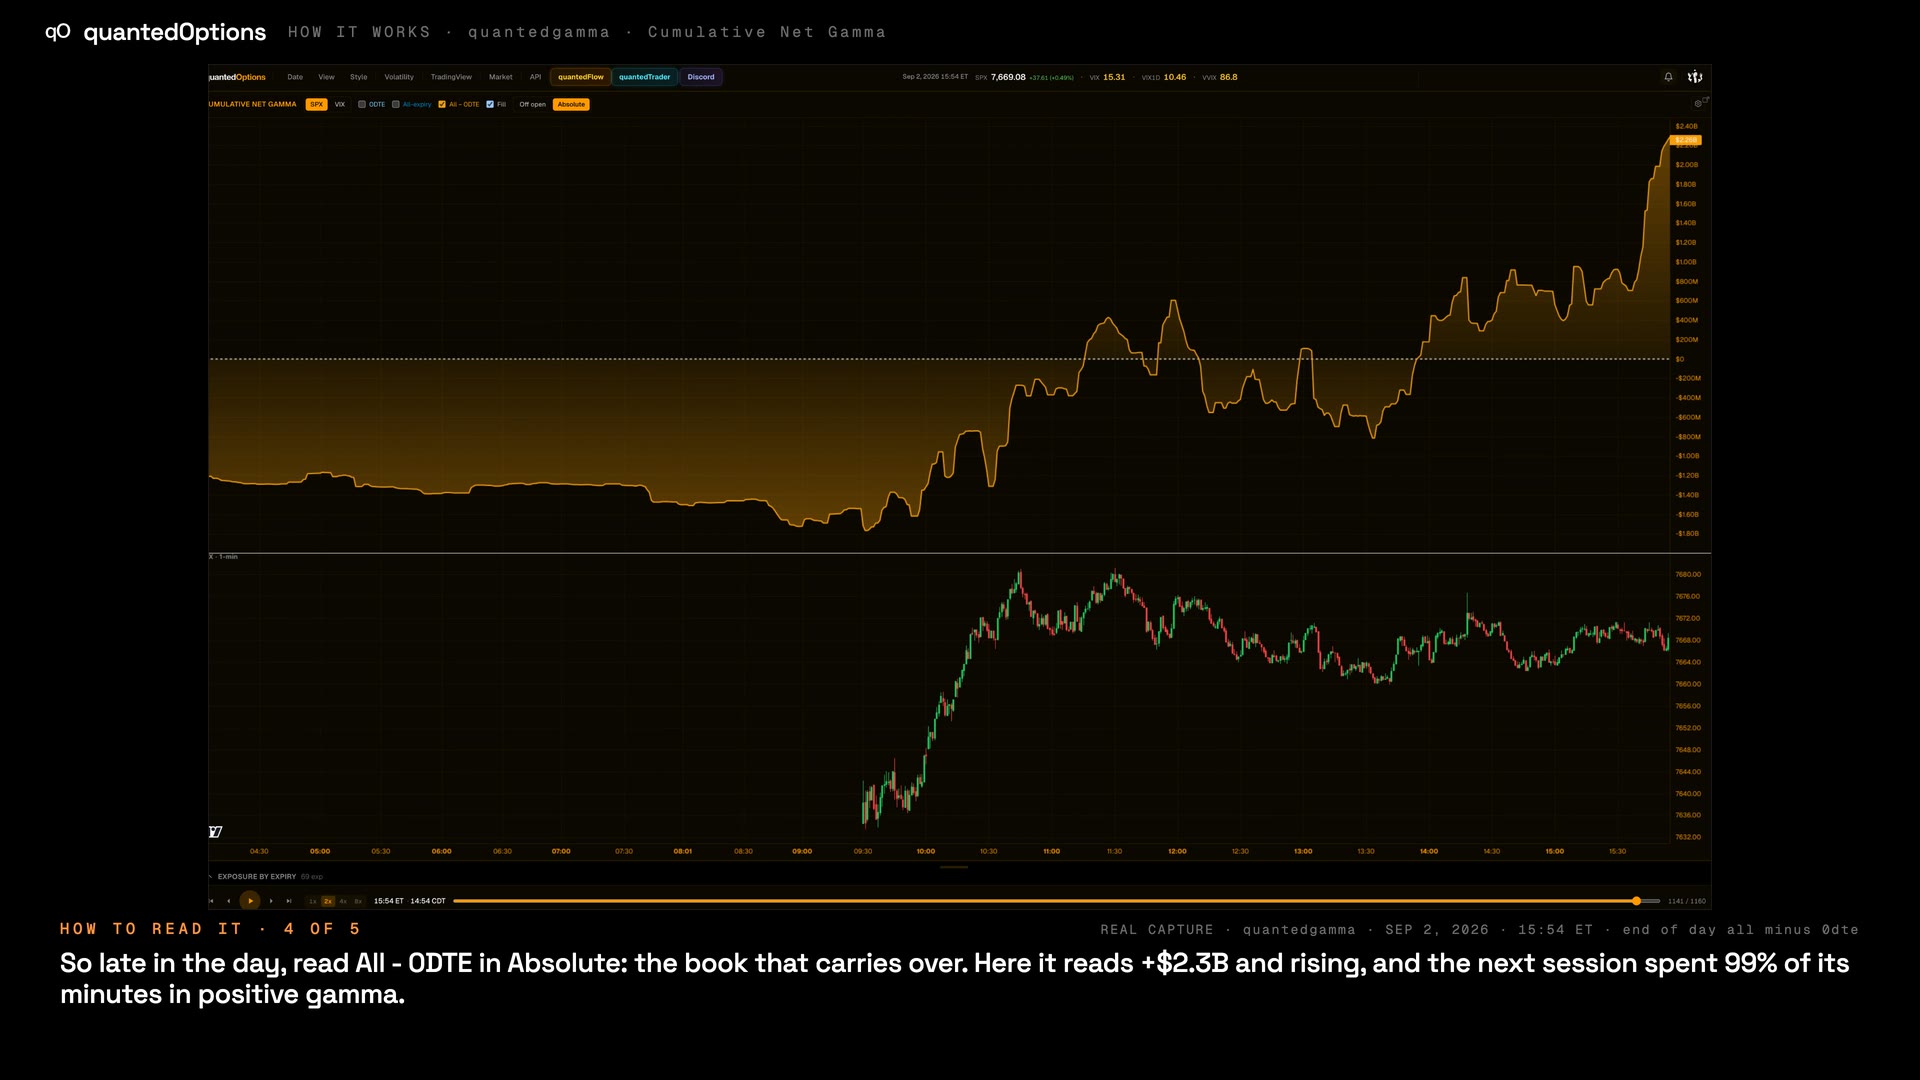
- 01Regime — Cumulative Net Gamma in Absolute: is the book above or below zero? Late in the day, read All − 0DTE for tomorrow's regime.
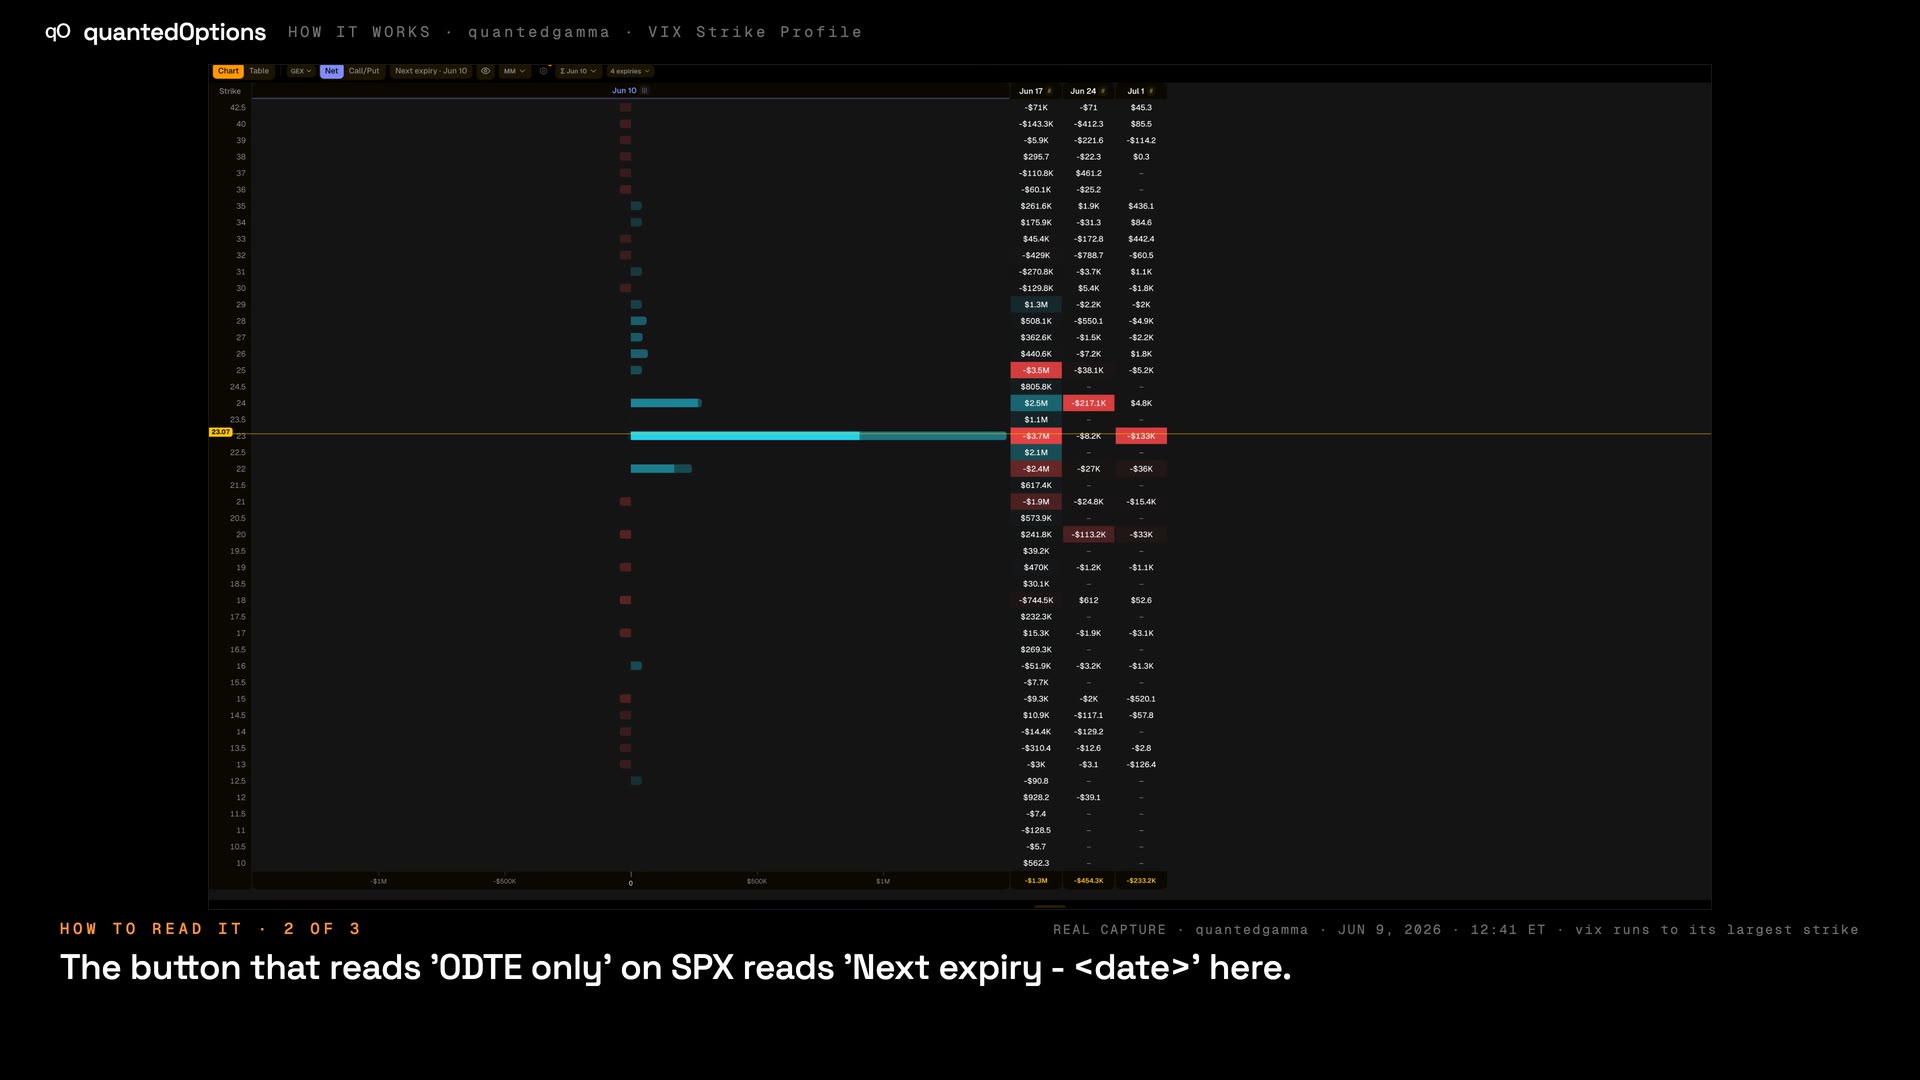
- 02Ladder — SPX Strike Profile: which strike is largest, and is it positive or negative?
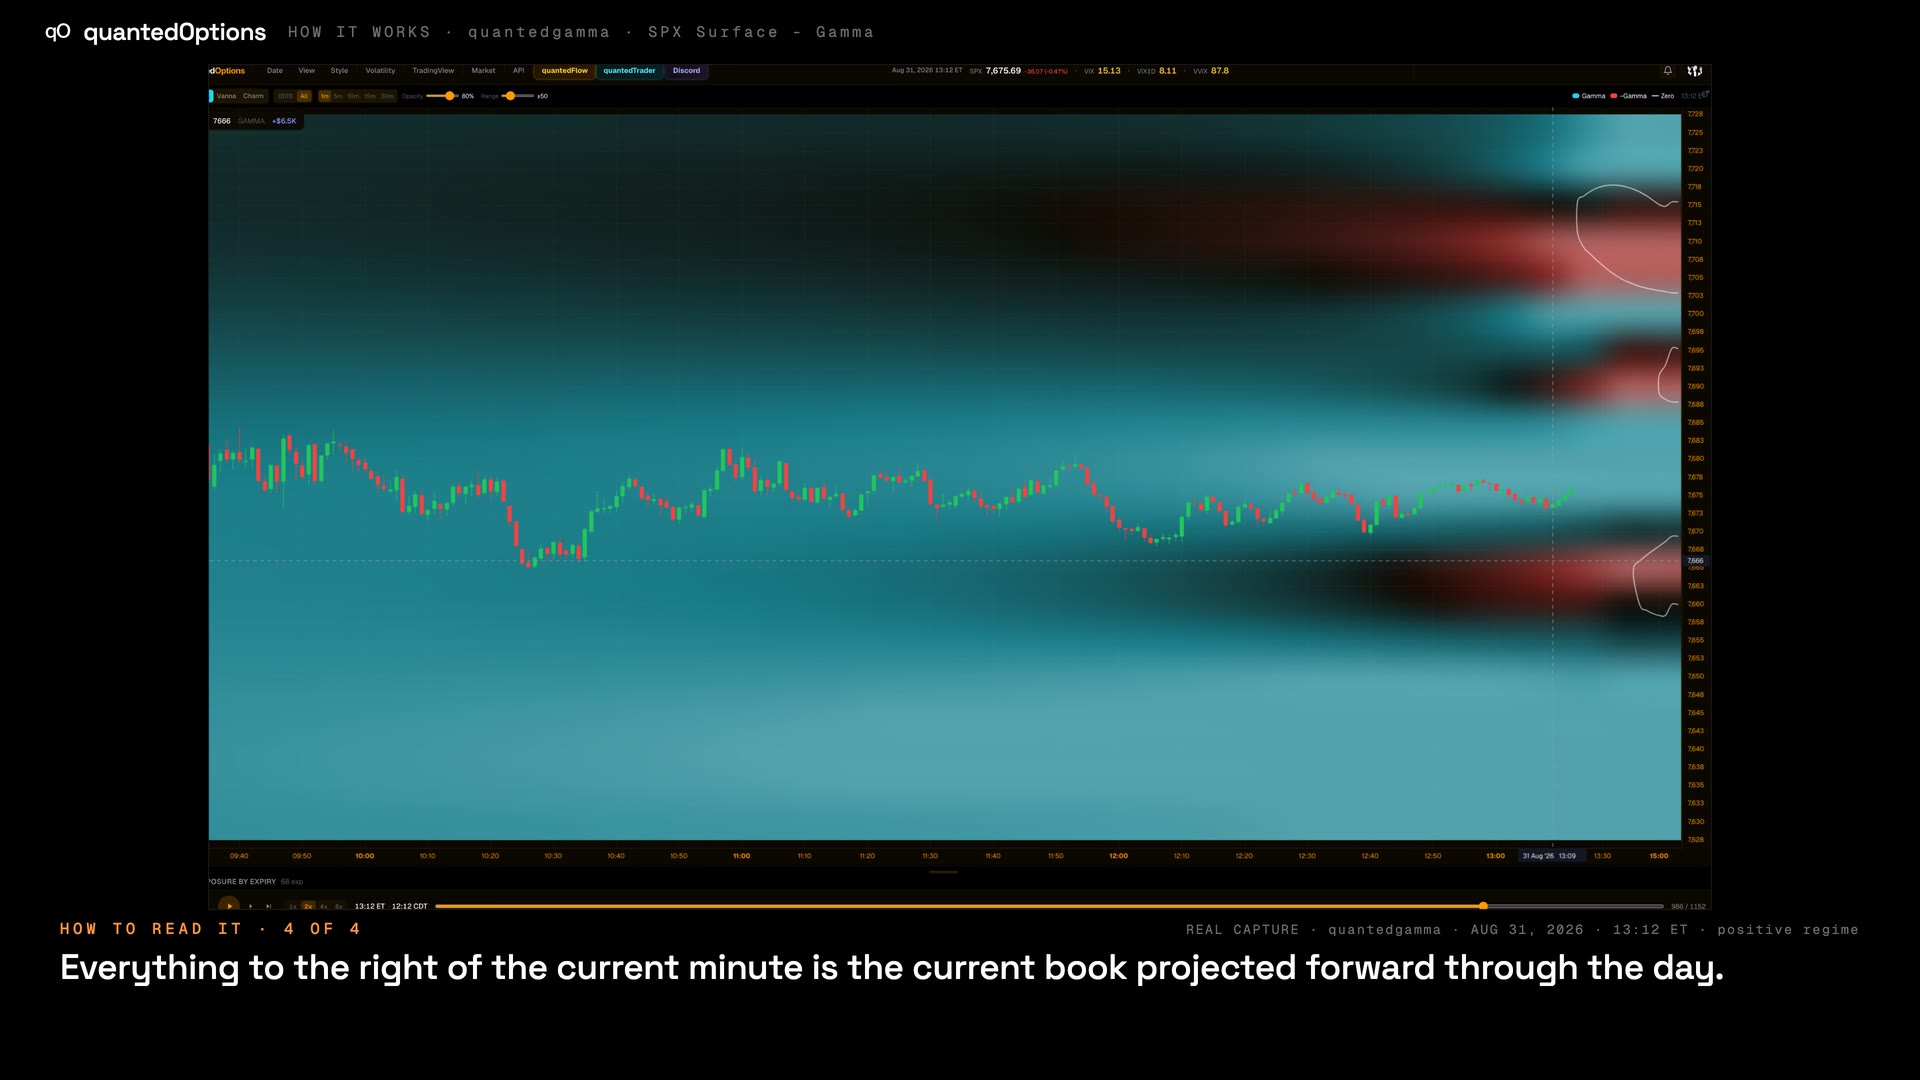
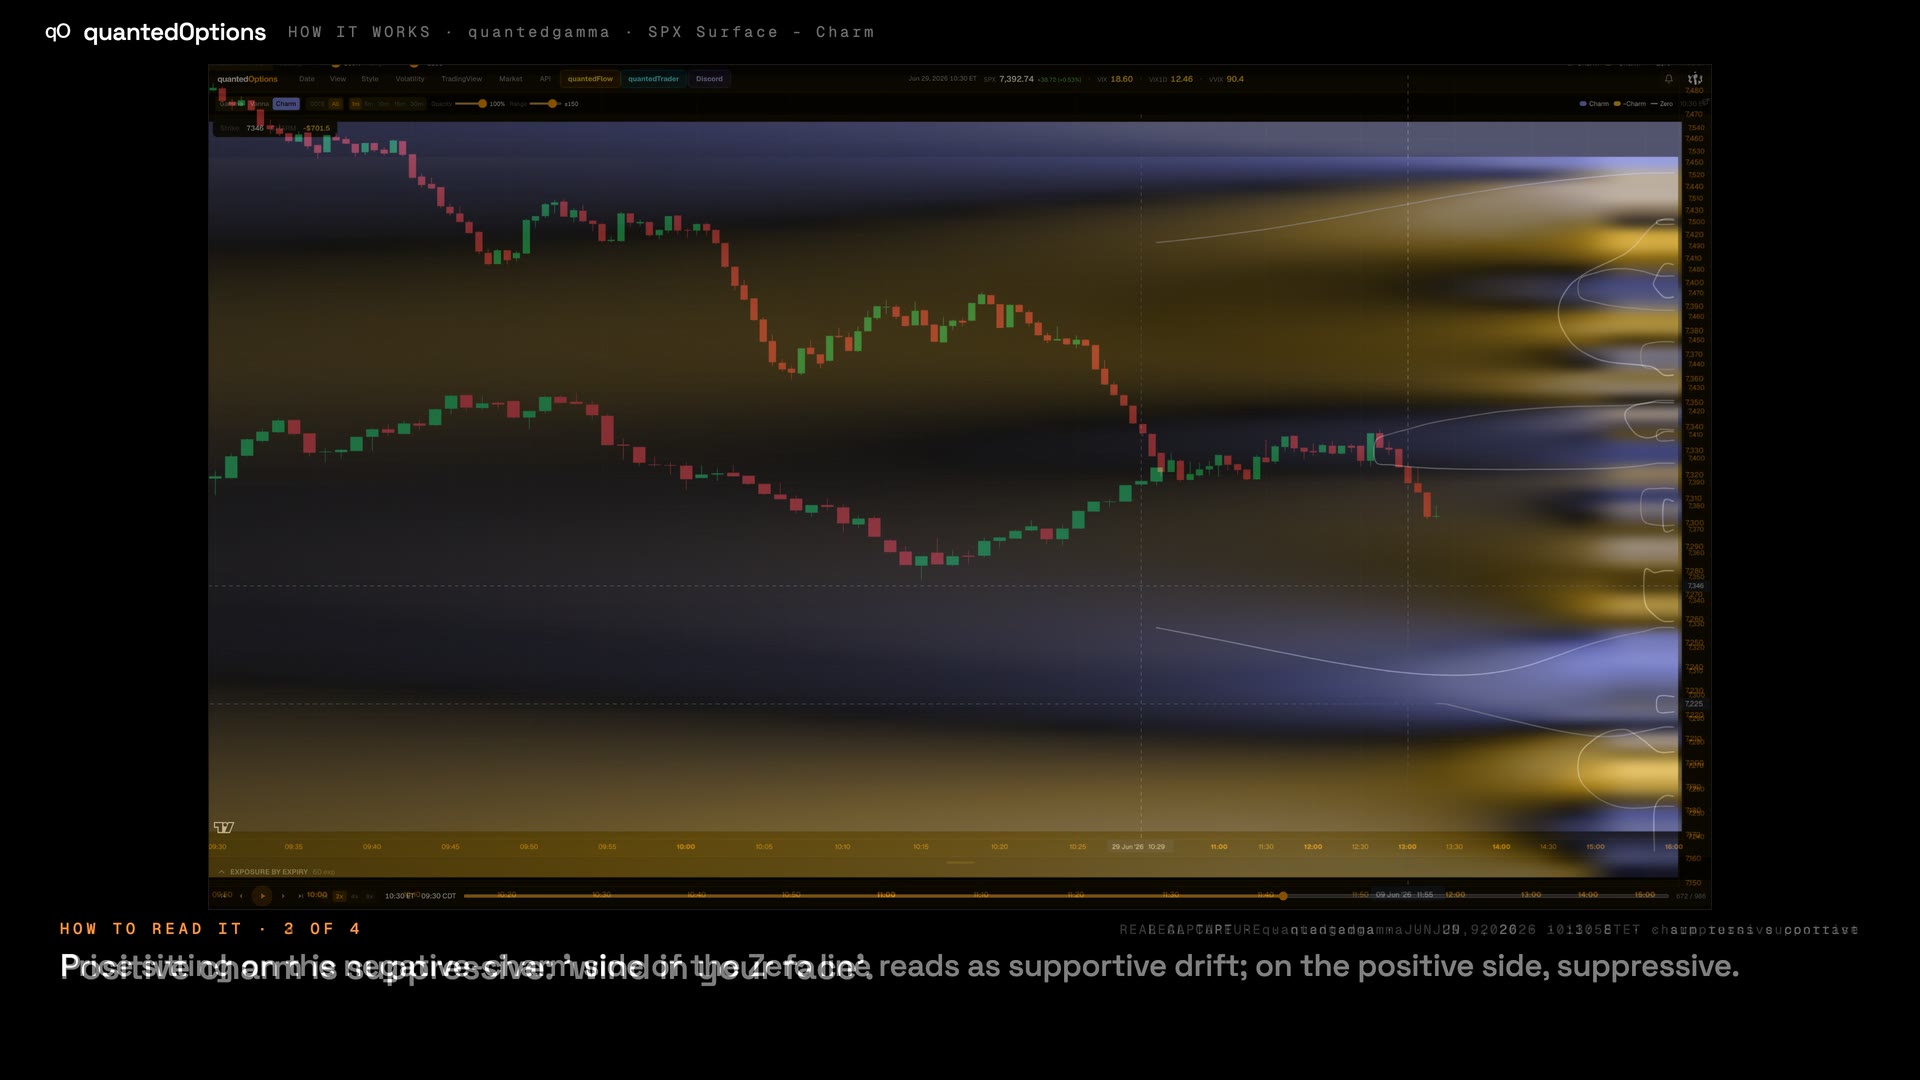
- 03Surfaces — Gamma and Charm surfaces: the same book across price and time.
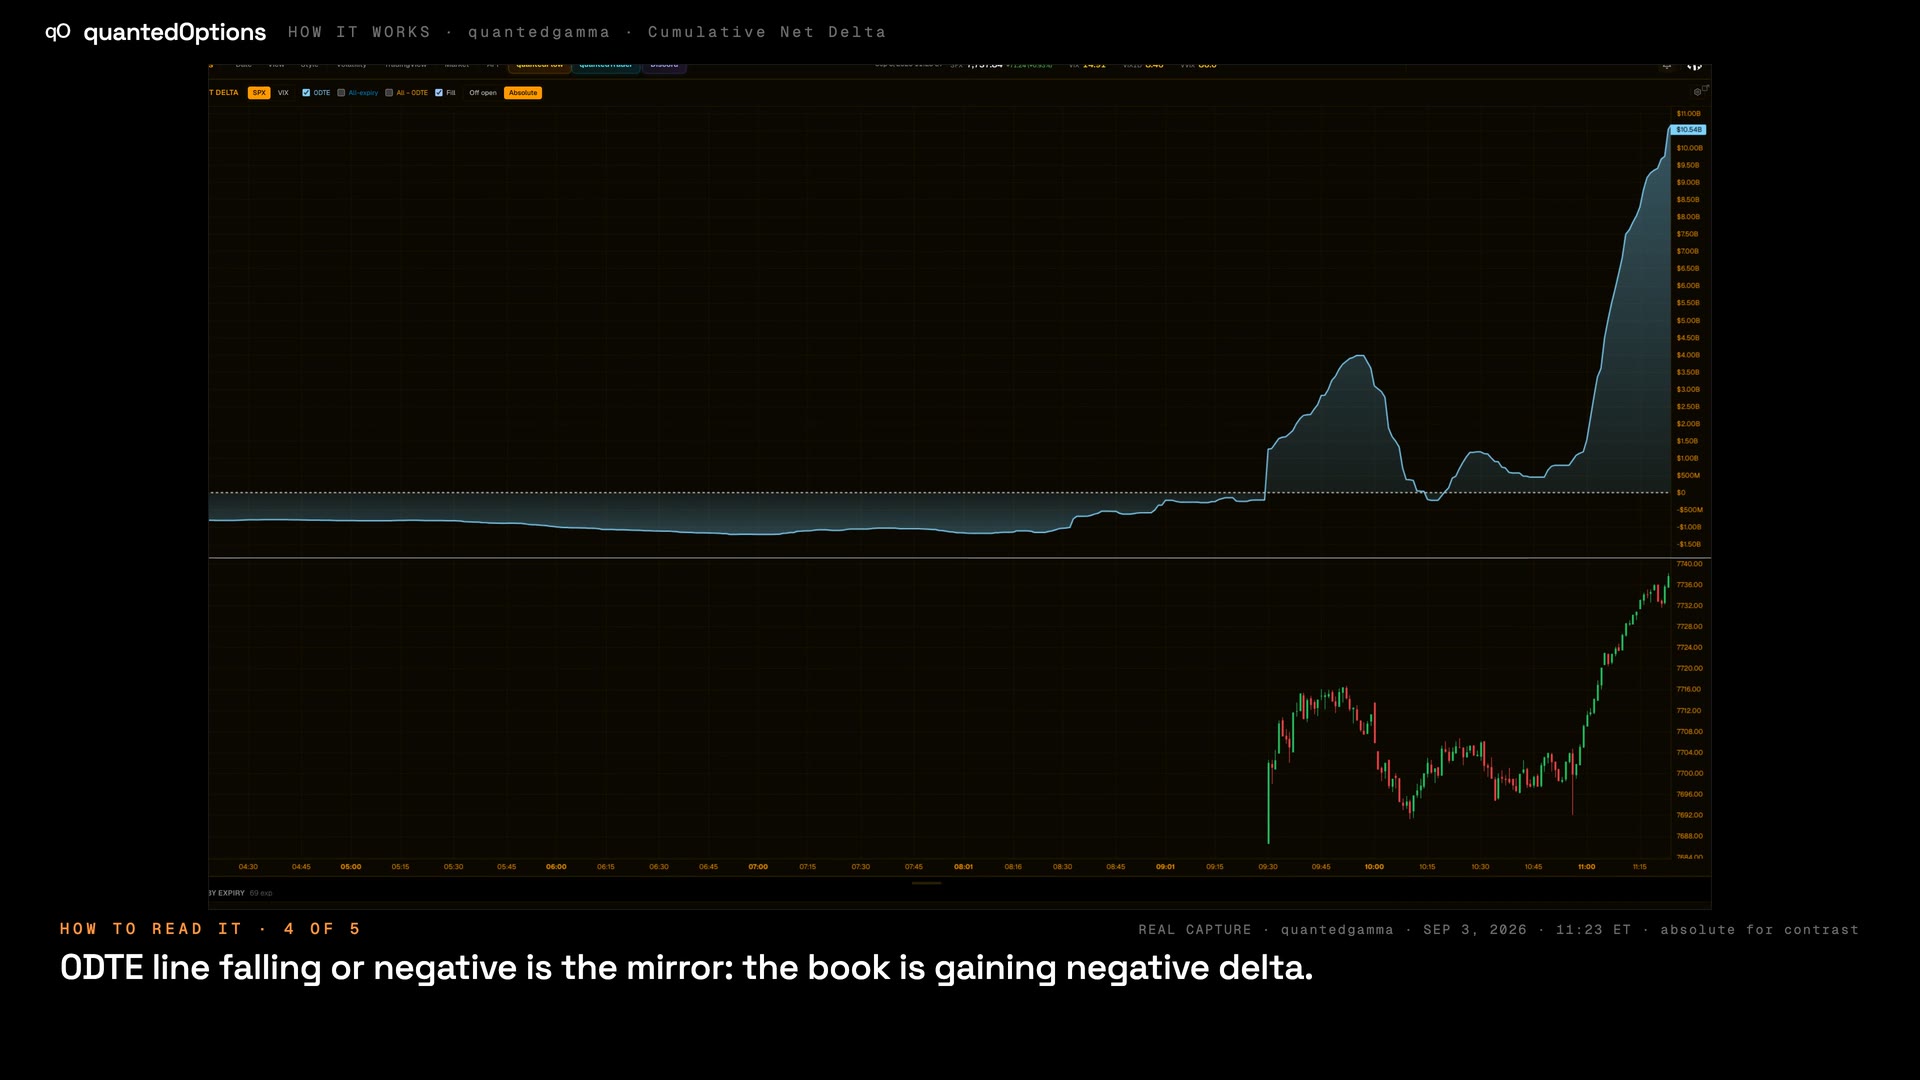
- 04Flow and delta — Premium Flow and Cumulative Net Delta: what the market maker bought or sold, and what that book's delta is doing.
- 05Replay — Scrub or play any minute of any stored session; every widget on the page follows.
the regime and the ladder
 1:16
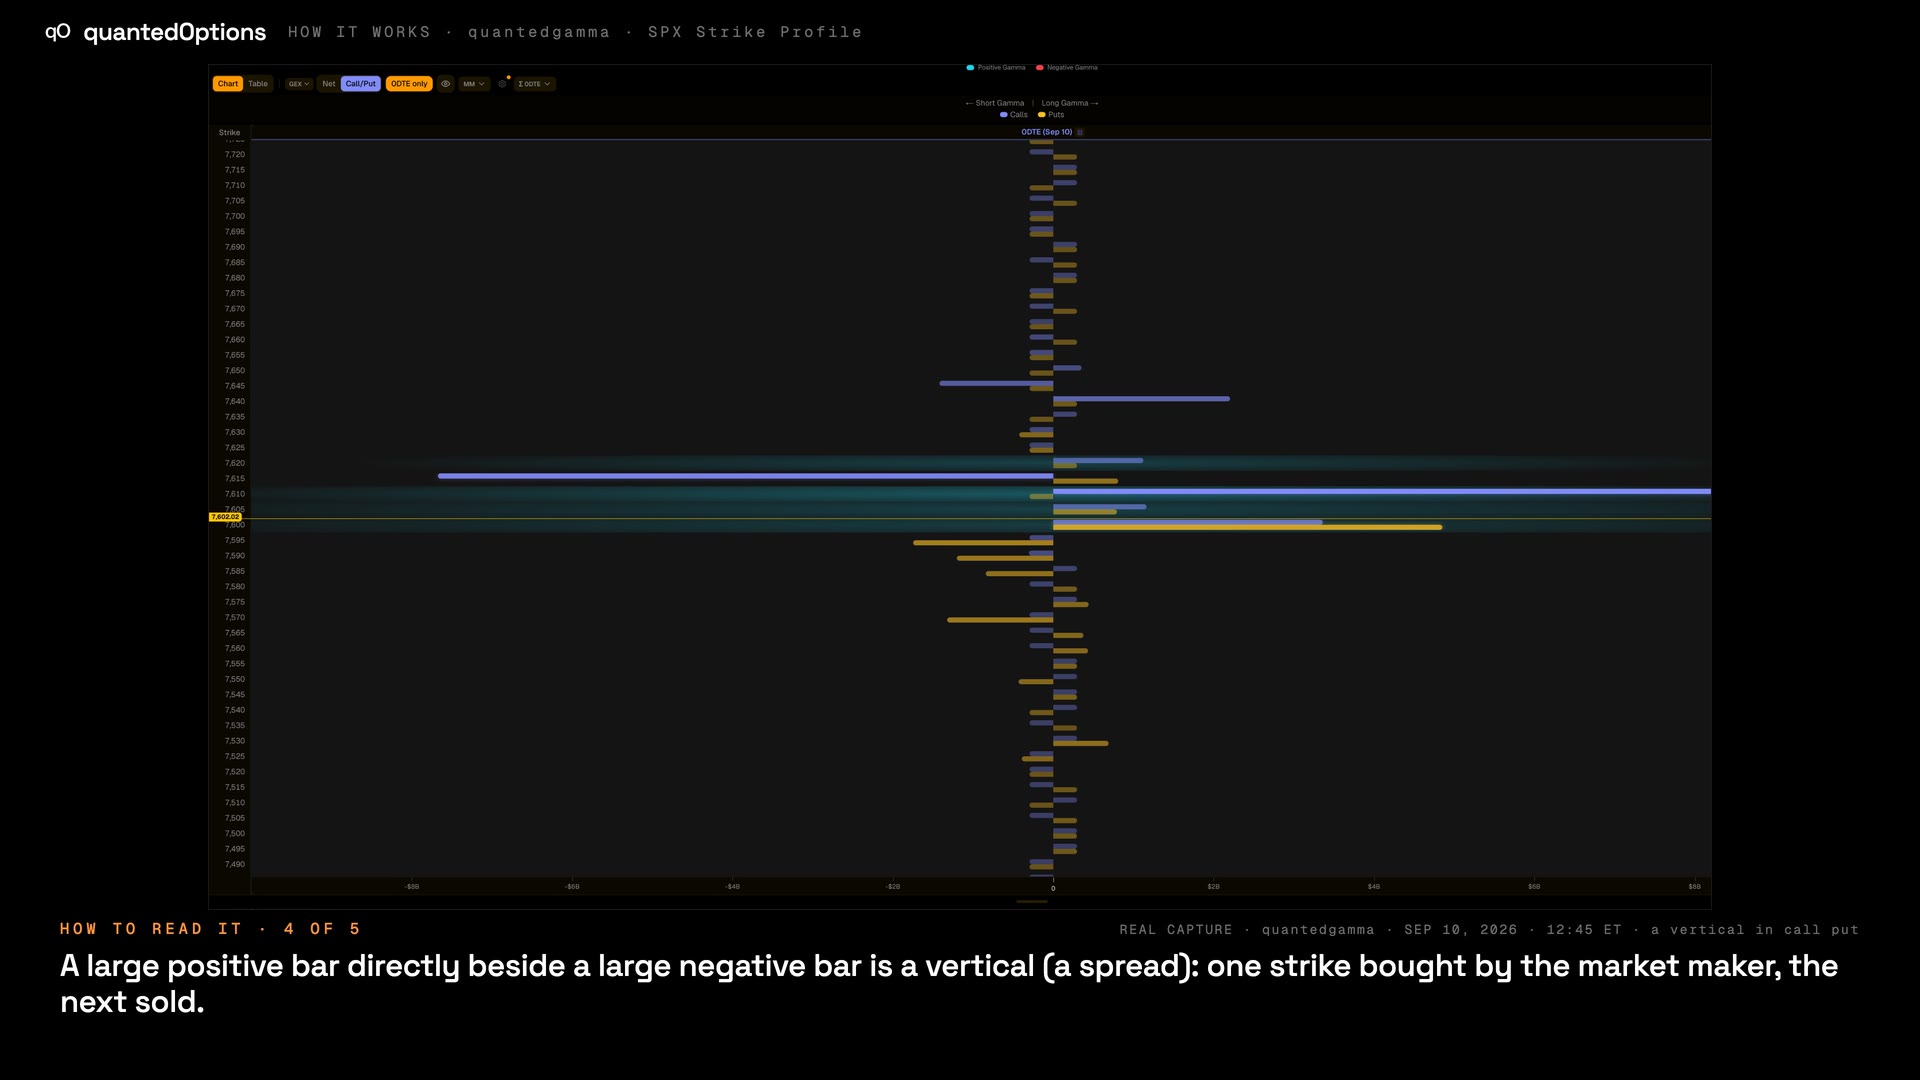
1:16SPX Strike Profile
Market-maker exposure at every strike, as a ladder of bars, minute by minute.
 1:11
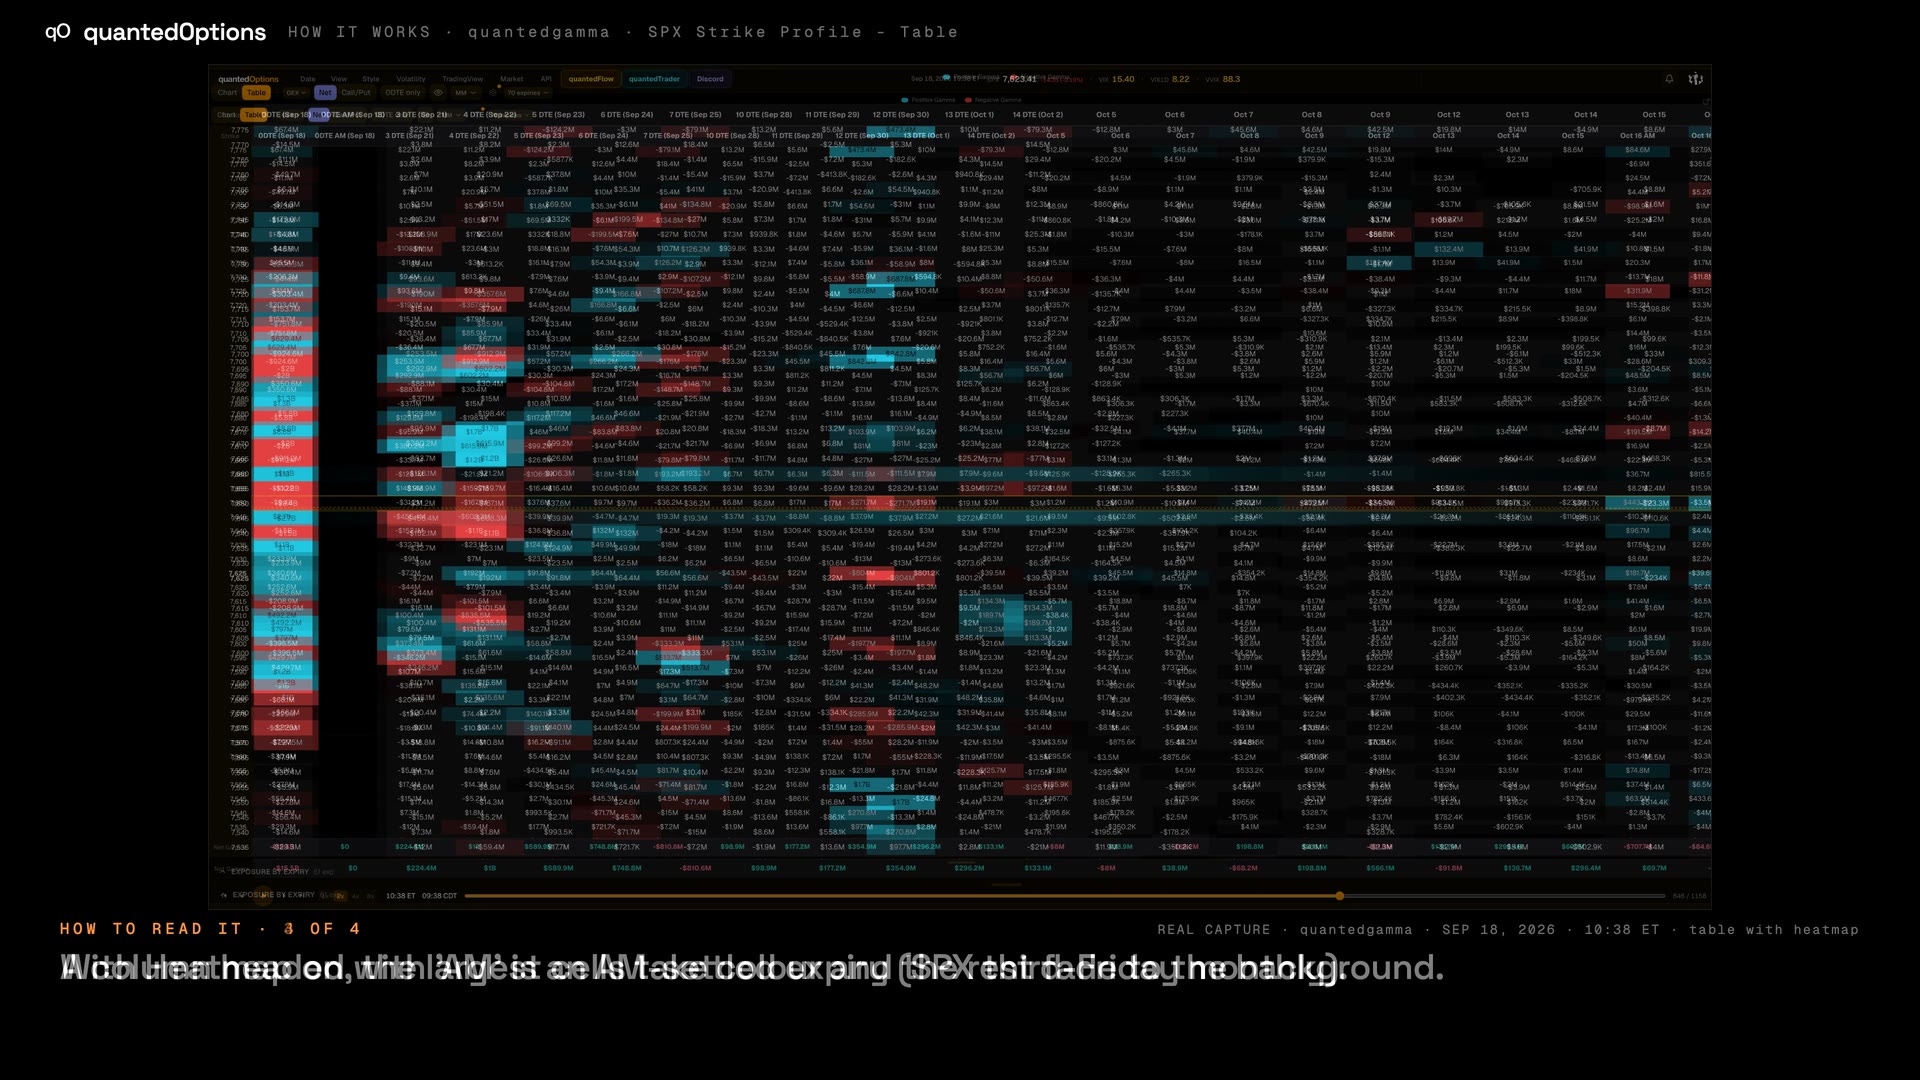
1:11SPX Strike Profile - Table
The same exposure as a strike-by-expiry grid of numbers.
 1:02
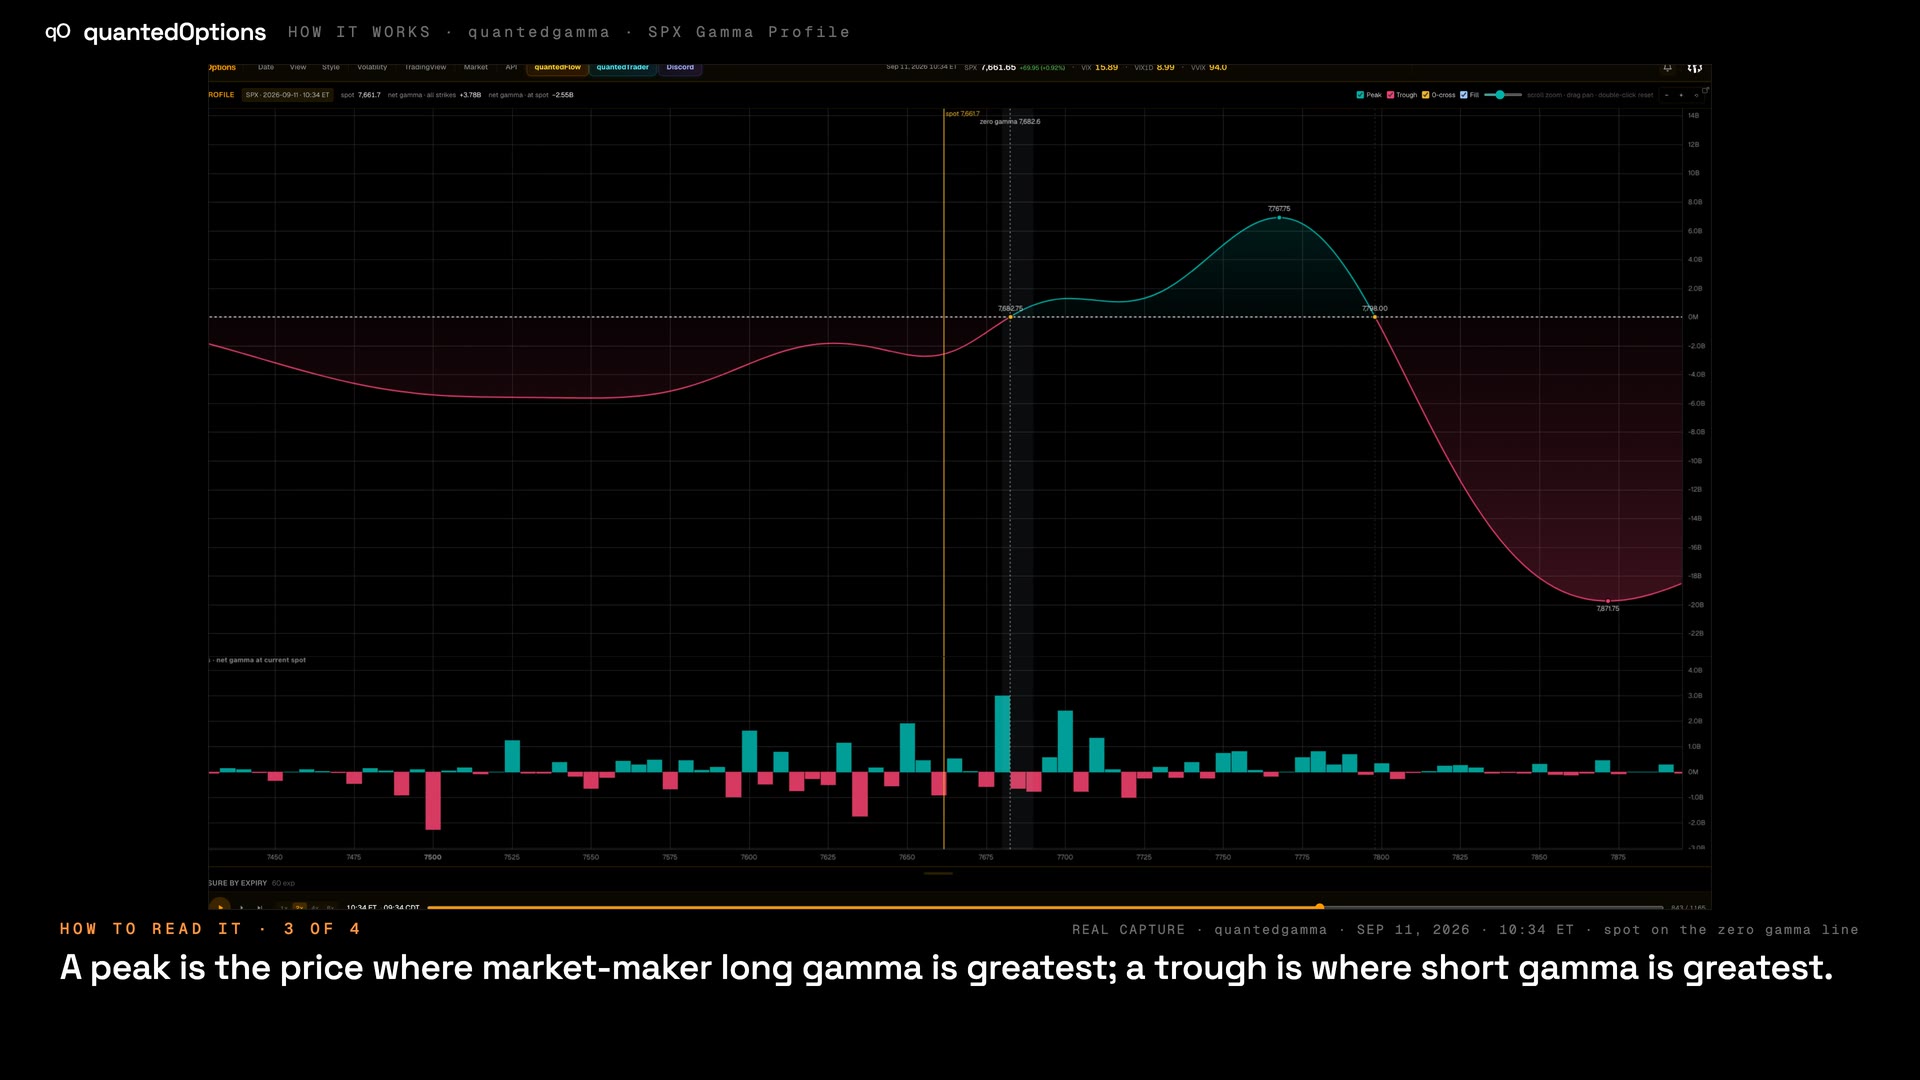
1:02SPX Gamma Profile
Net gamma if price were anywhere else: the regime curve and its zero crossing.
 1:15
1:15Cumulative Net Gamma
The market maker's net gamma through the session: the regime line, in its own slot.
 1:05
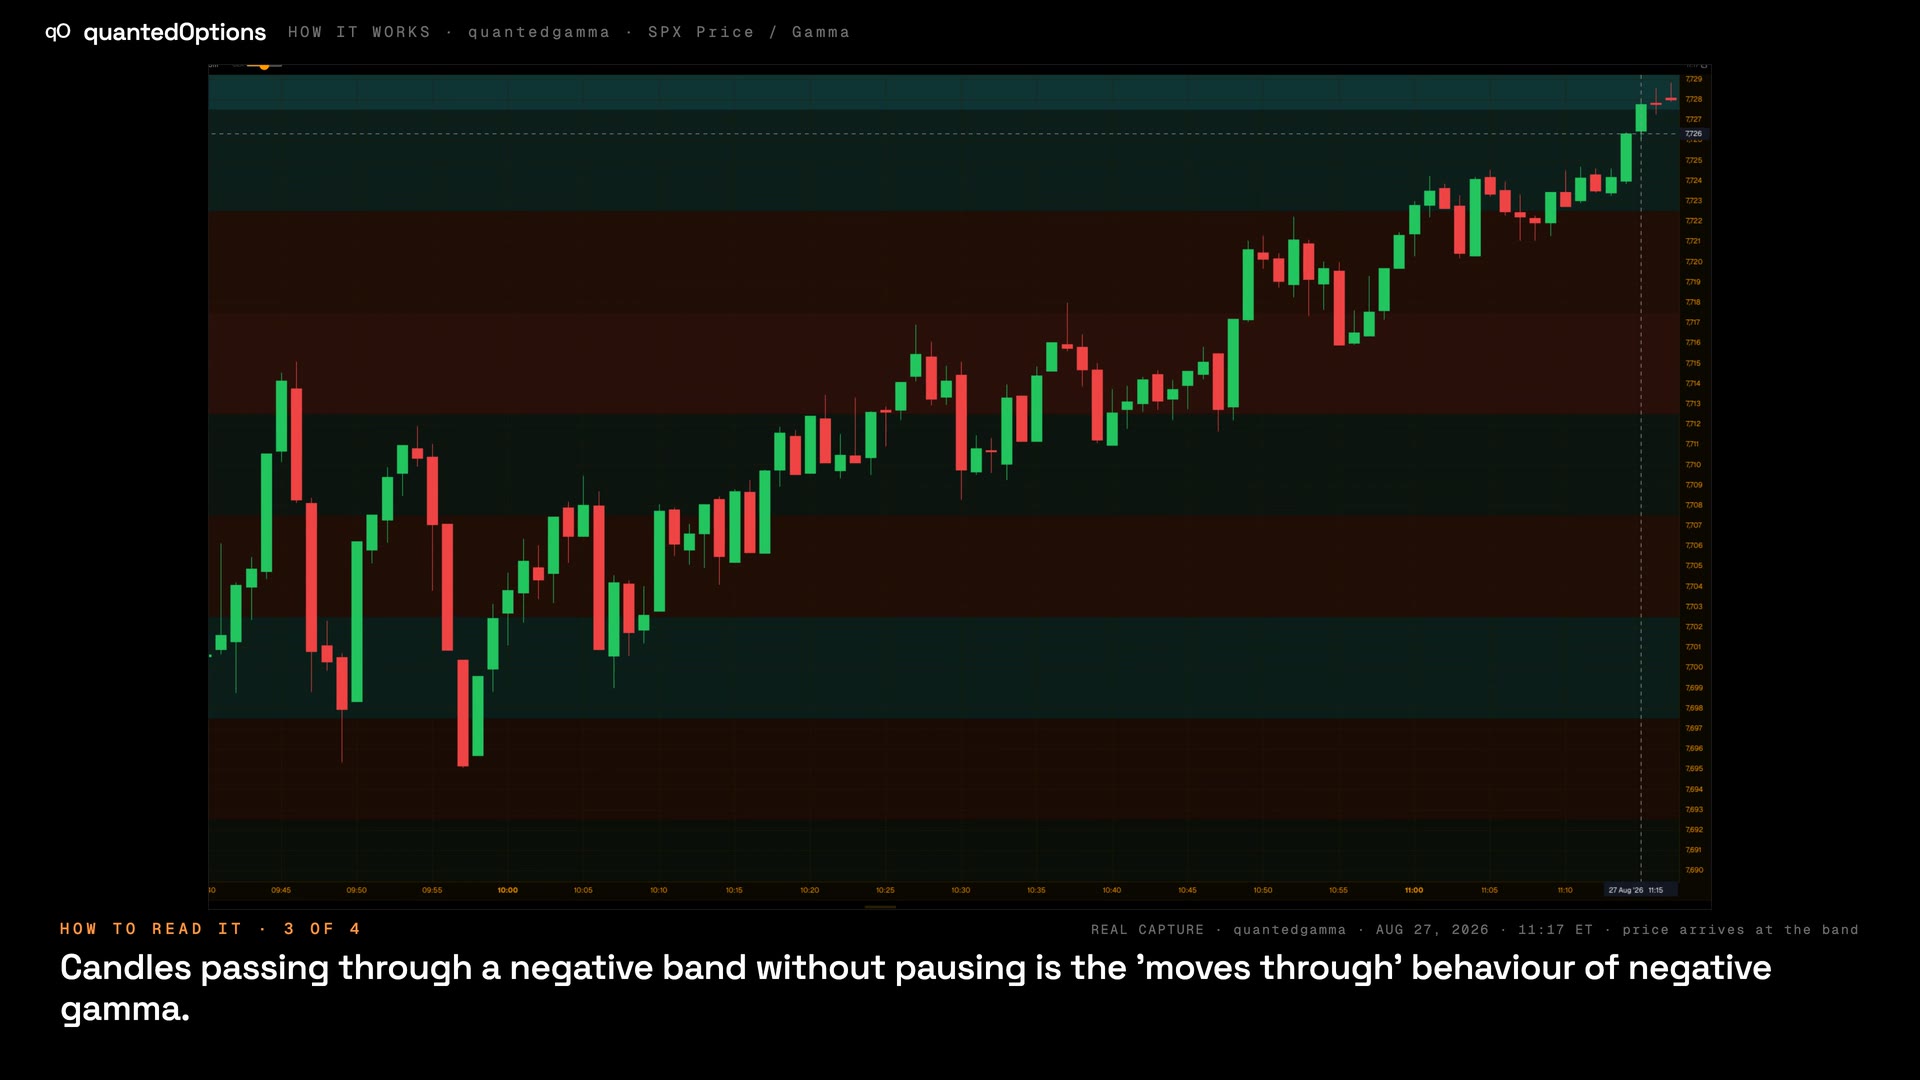
1:05SPX Price / Gamma
Candles with each strike's gamma drawn as a band across the chart.
 1:10
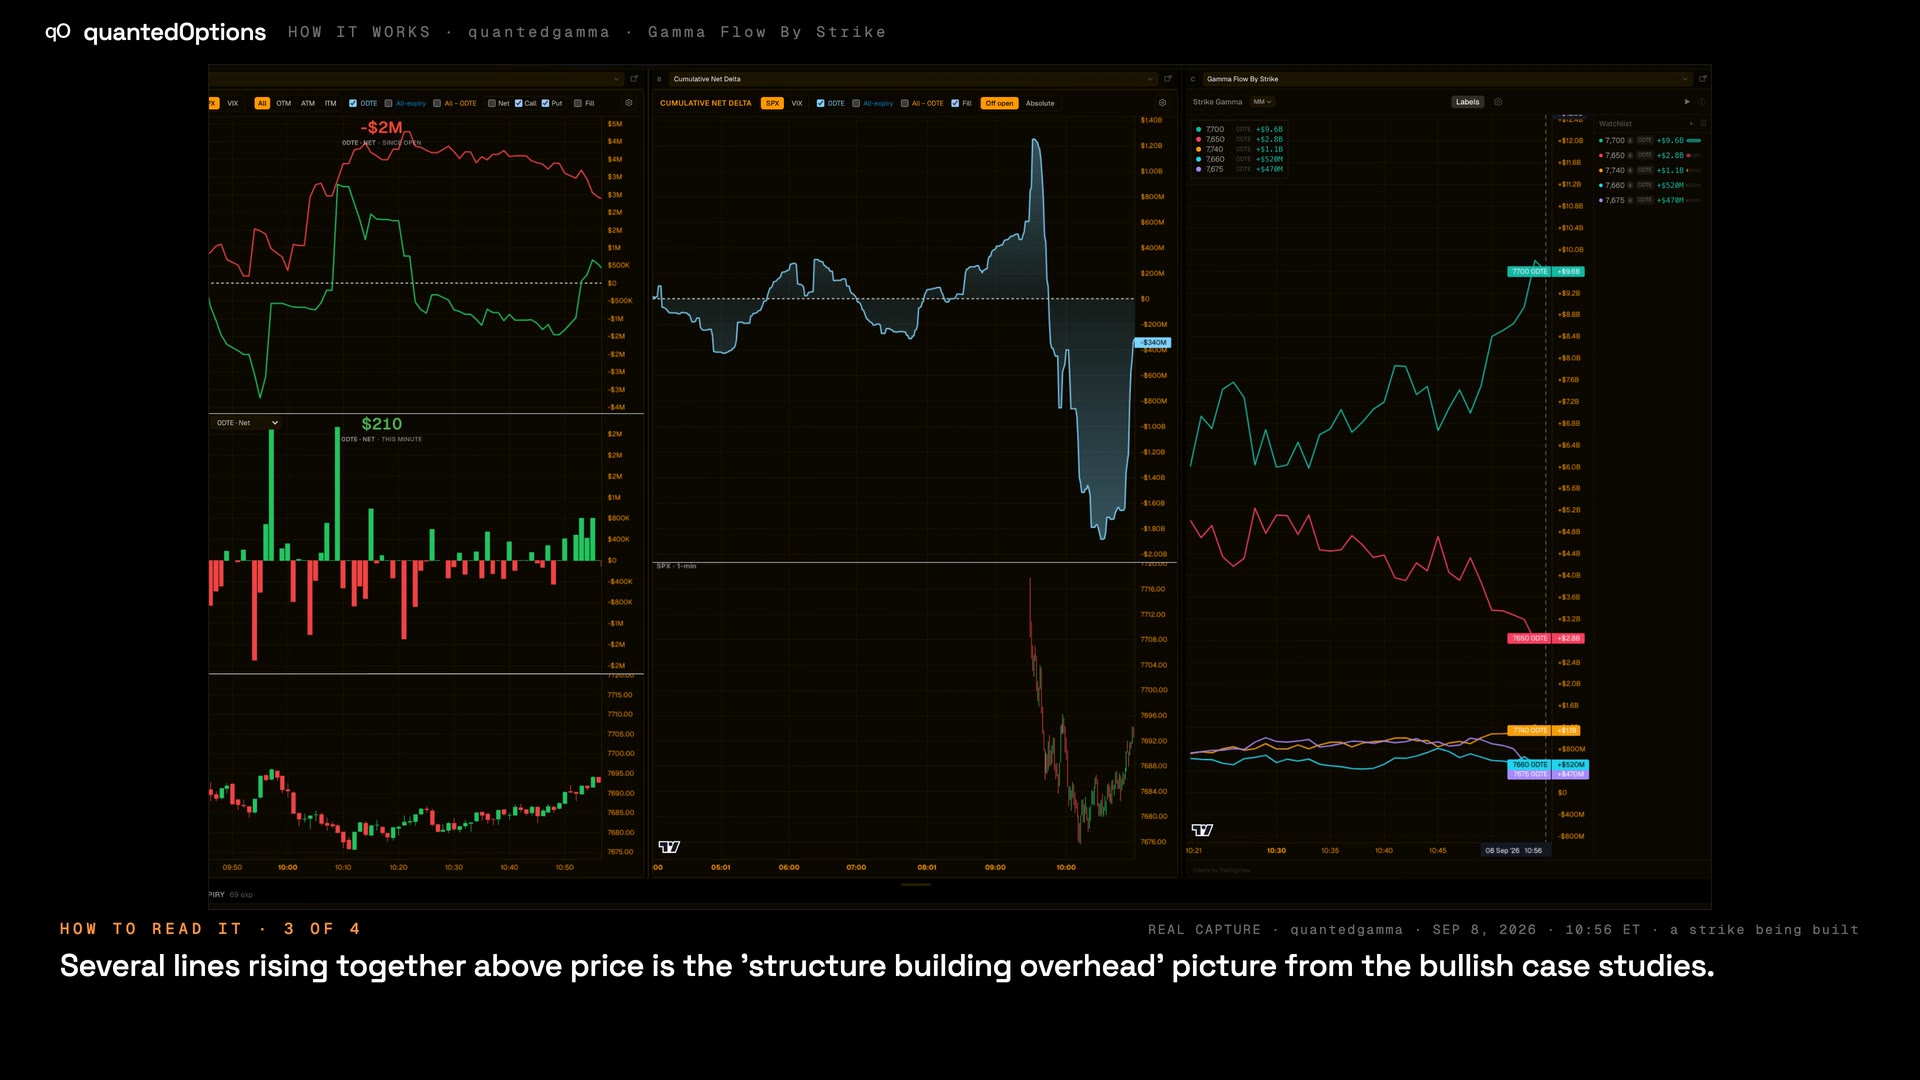
1:10Gamma Flow By Strike
One line per strike: how each strike's exposure has changed through the session.
surfaces
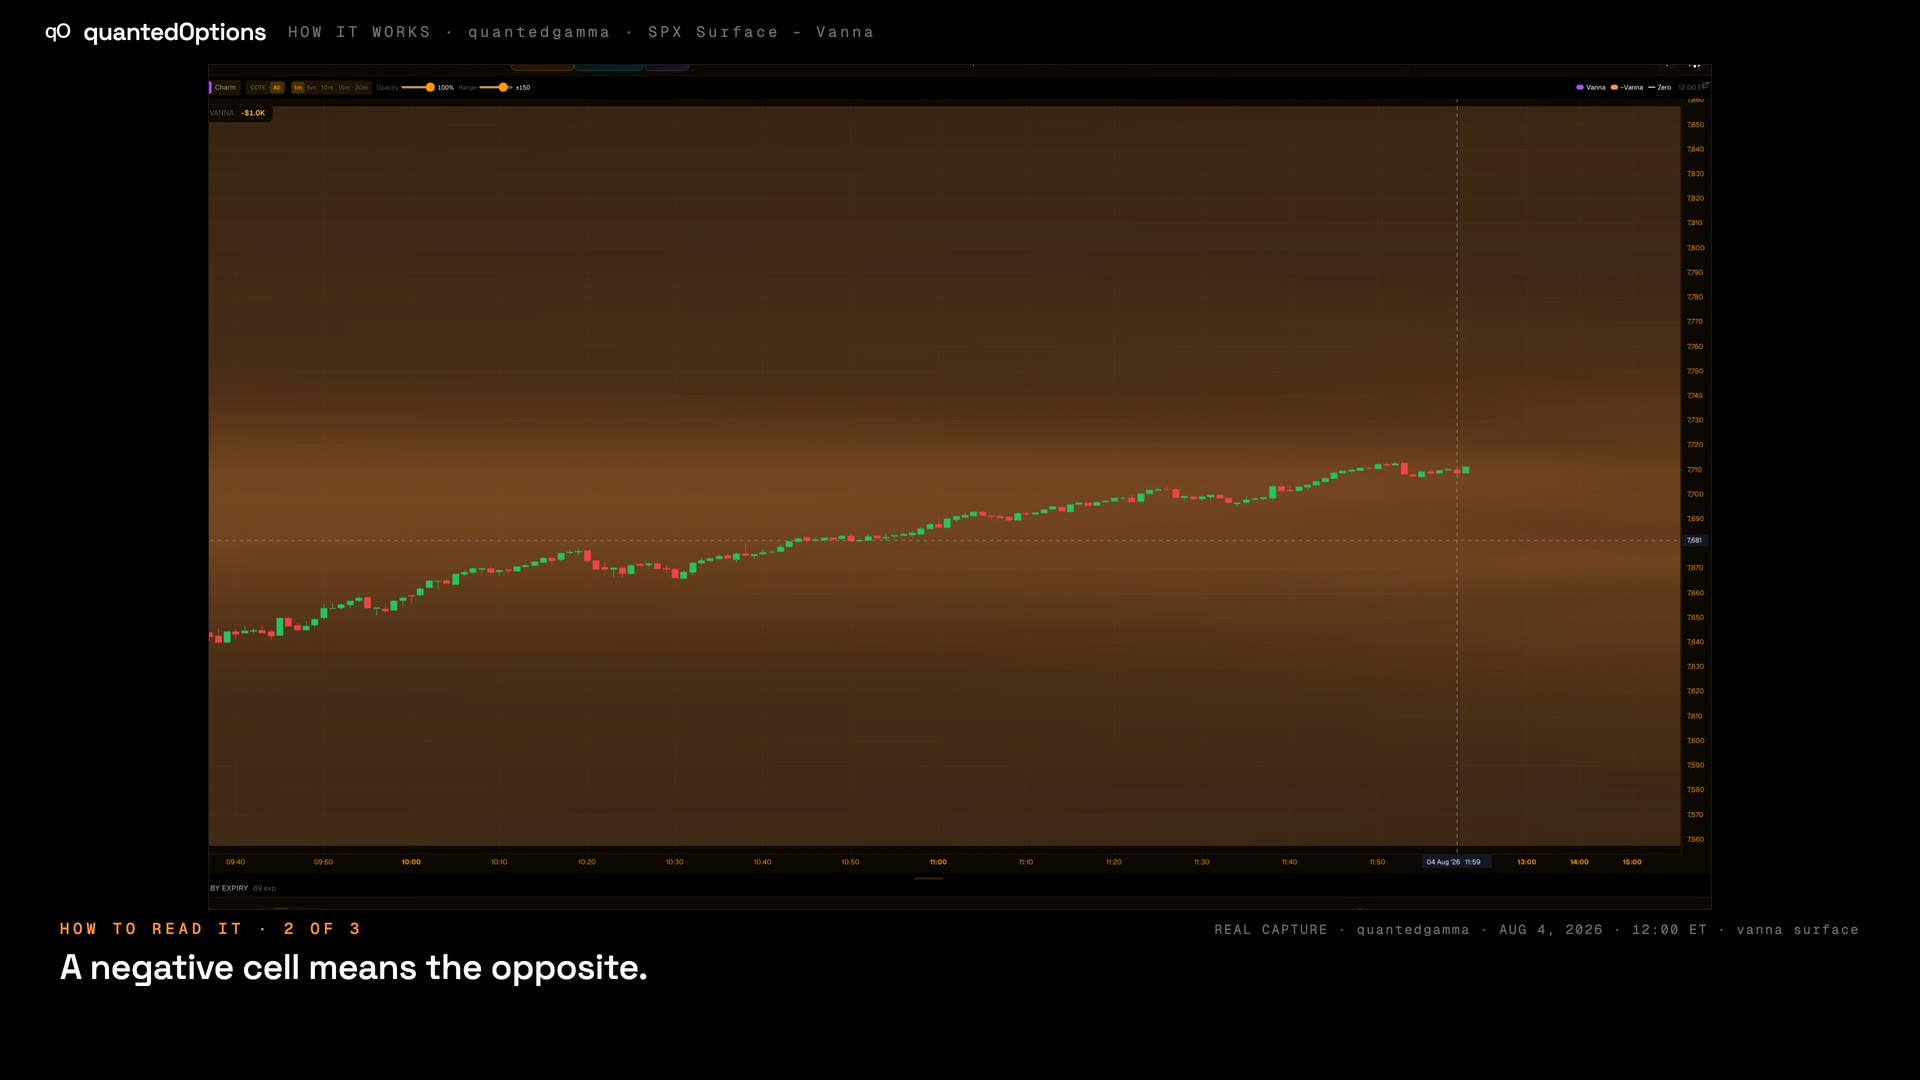
the page
 1:02
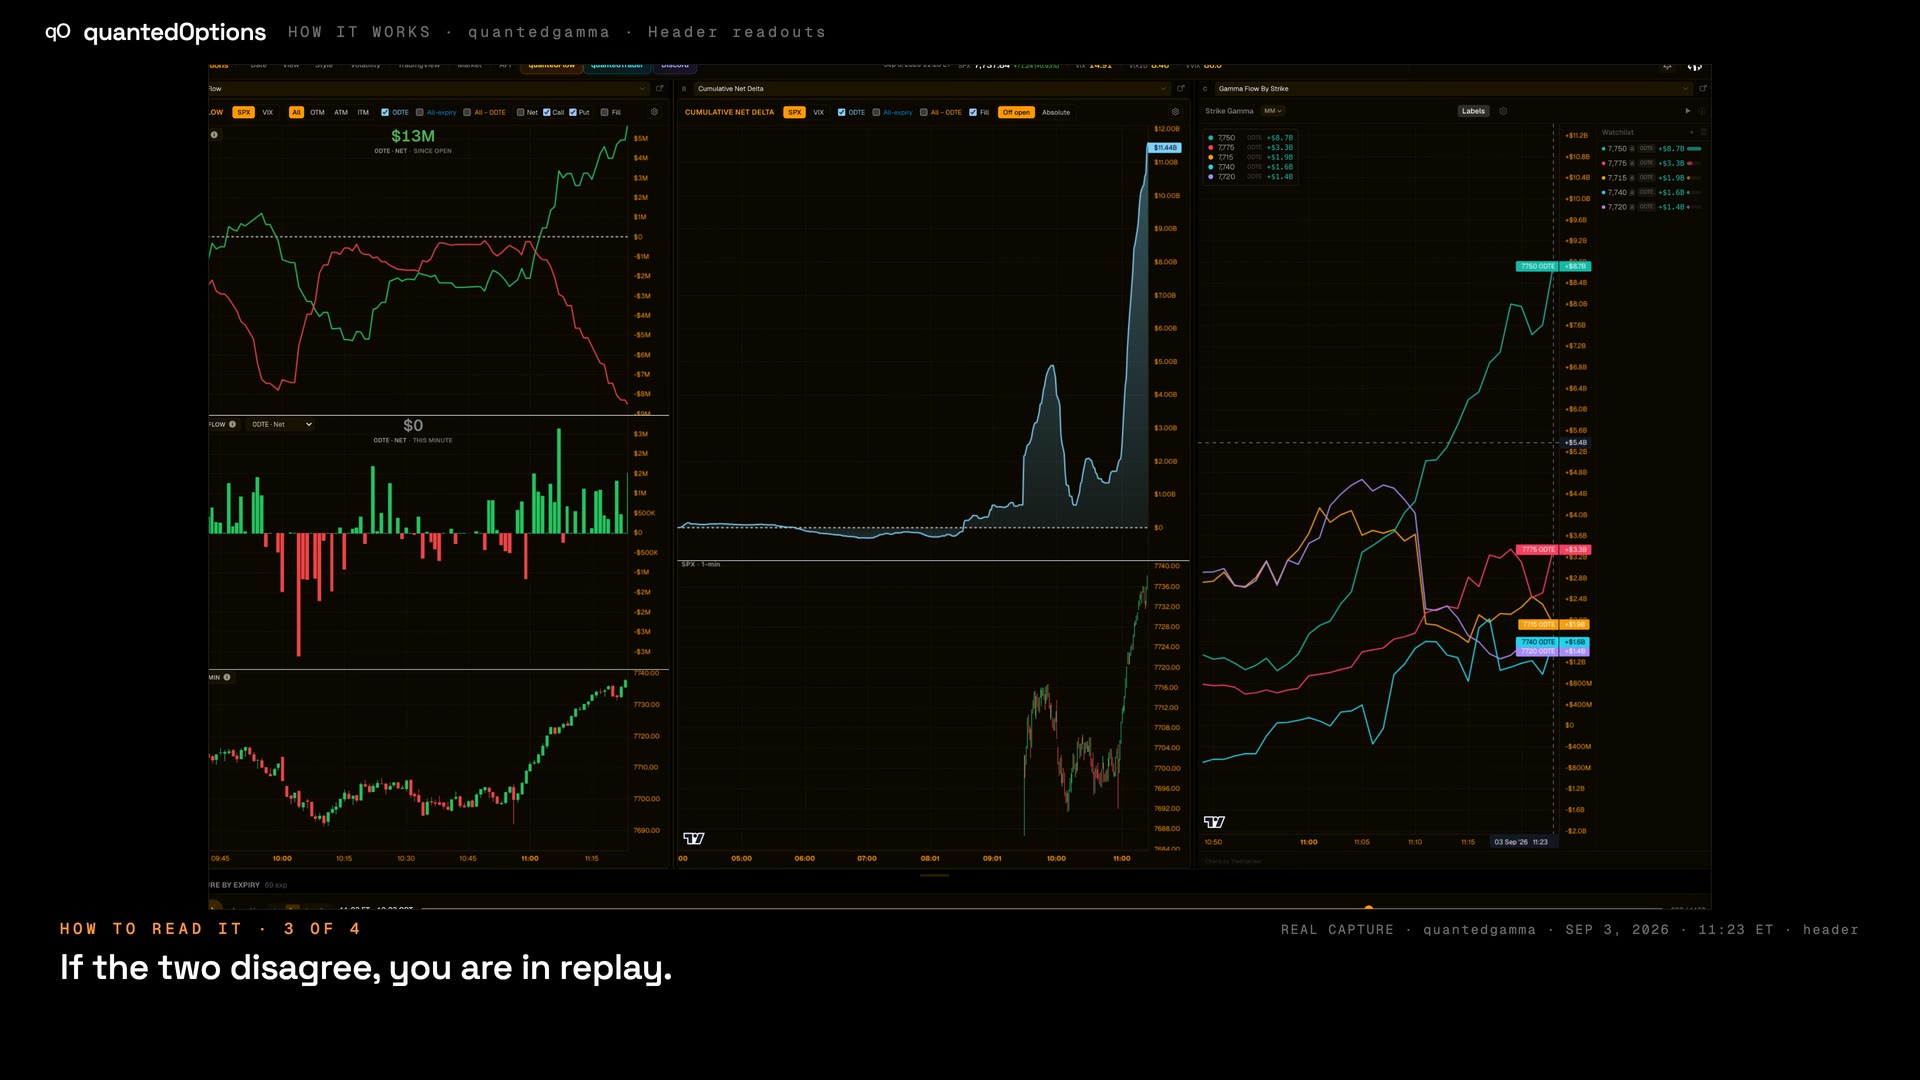
1:02Header readouts
The date, the replay minute, SPX, VIX, VIX1D and VVIX, and two clocks.
 1:00
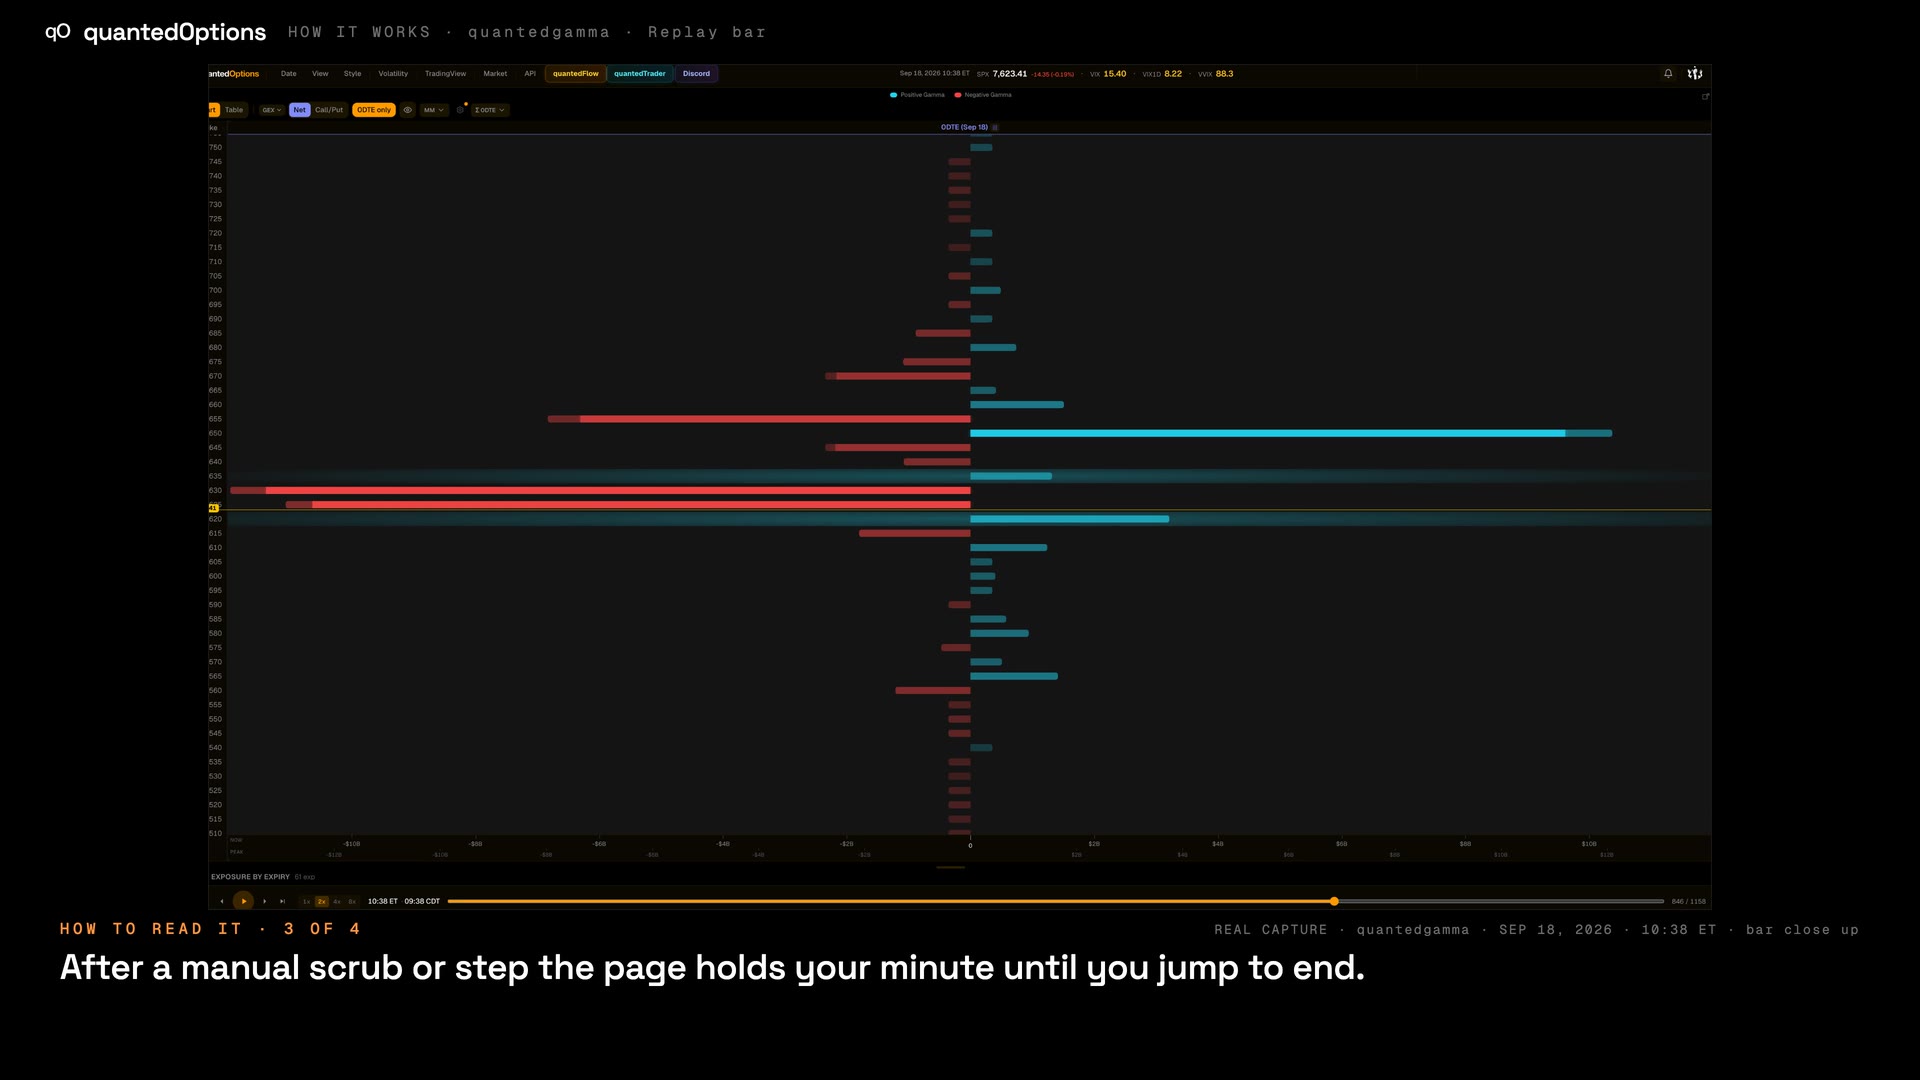
1:00Replay bar
Scrub or play any minute of any session; every widget follows.
 0:47
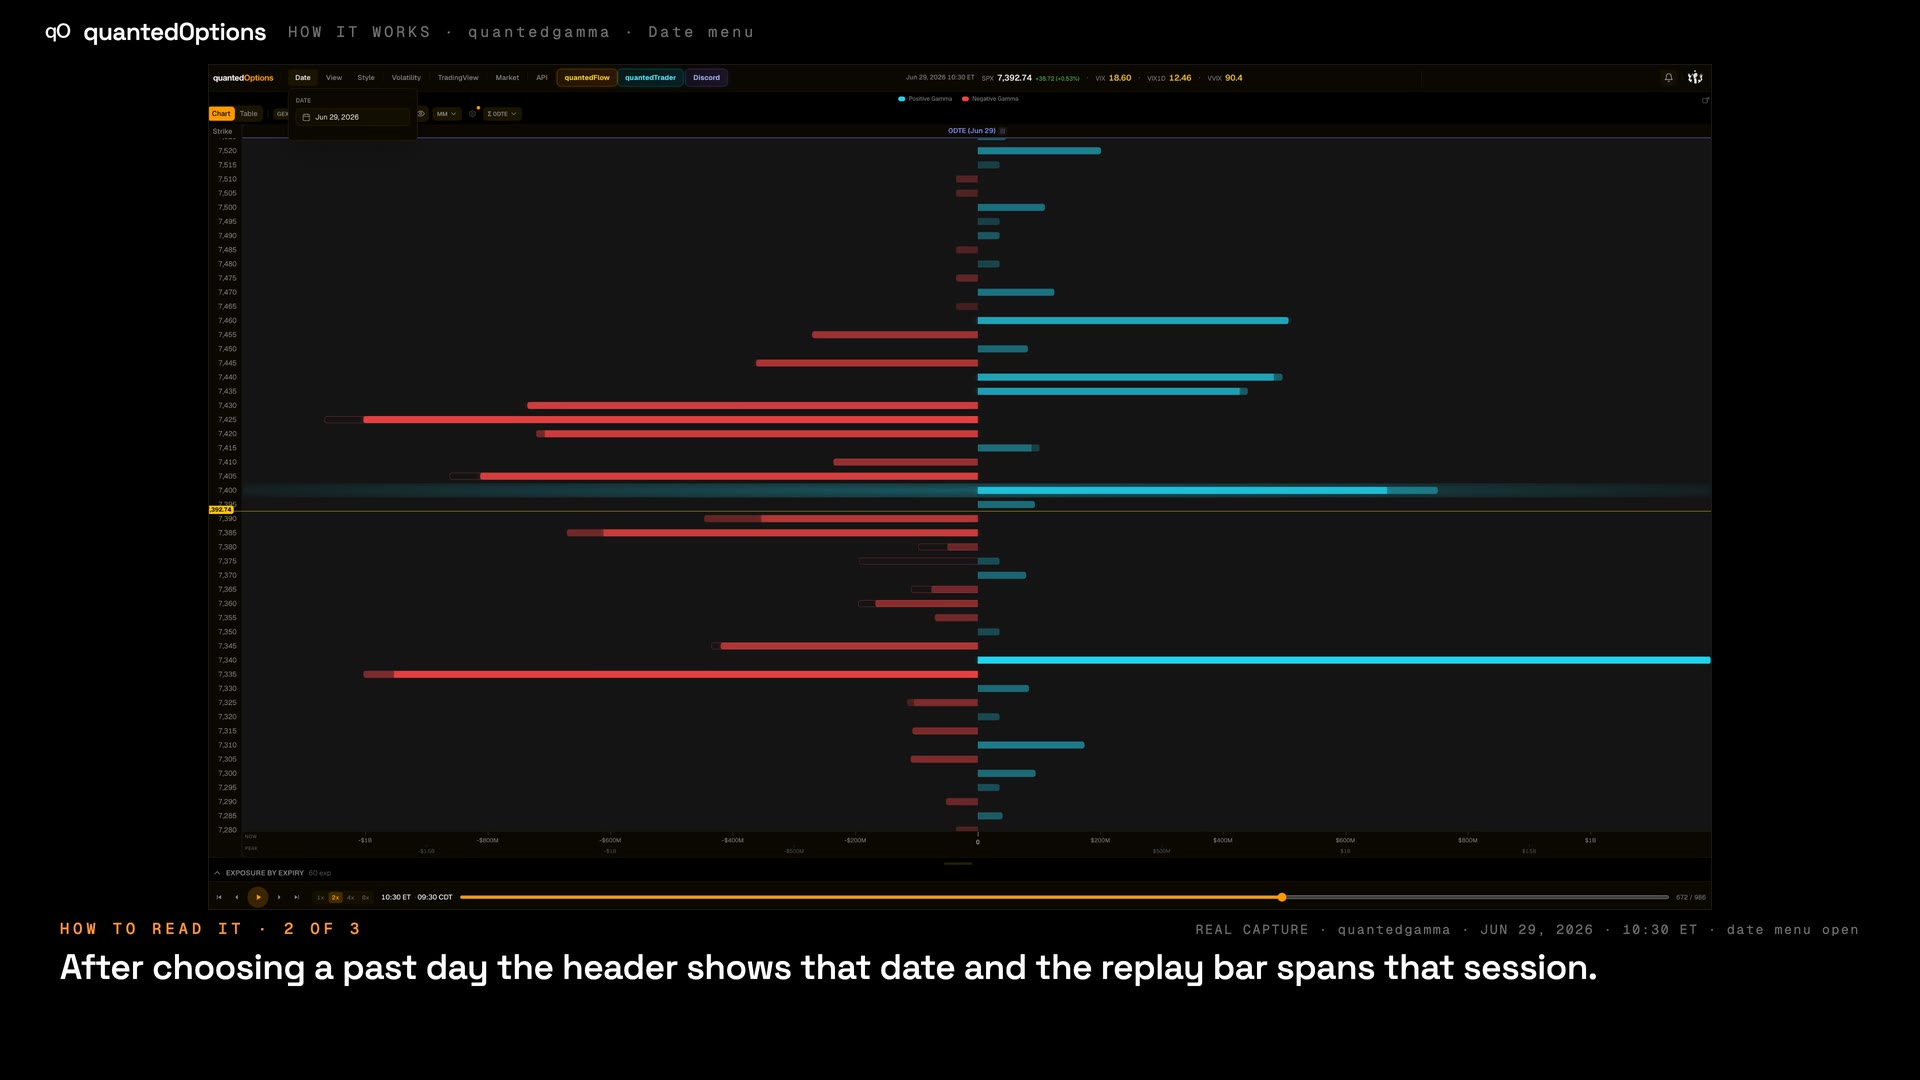
0:47Date menu
A calendar of stored sessions; pick one and the whole page loads it.
 1:19
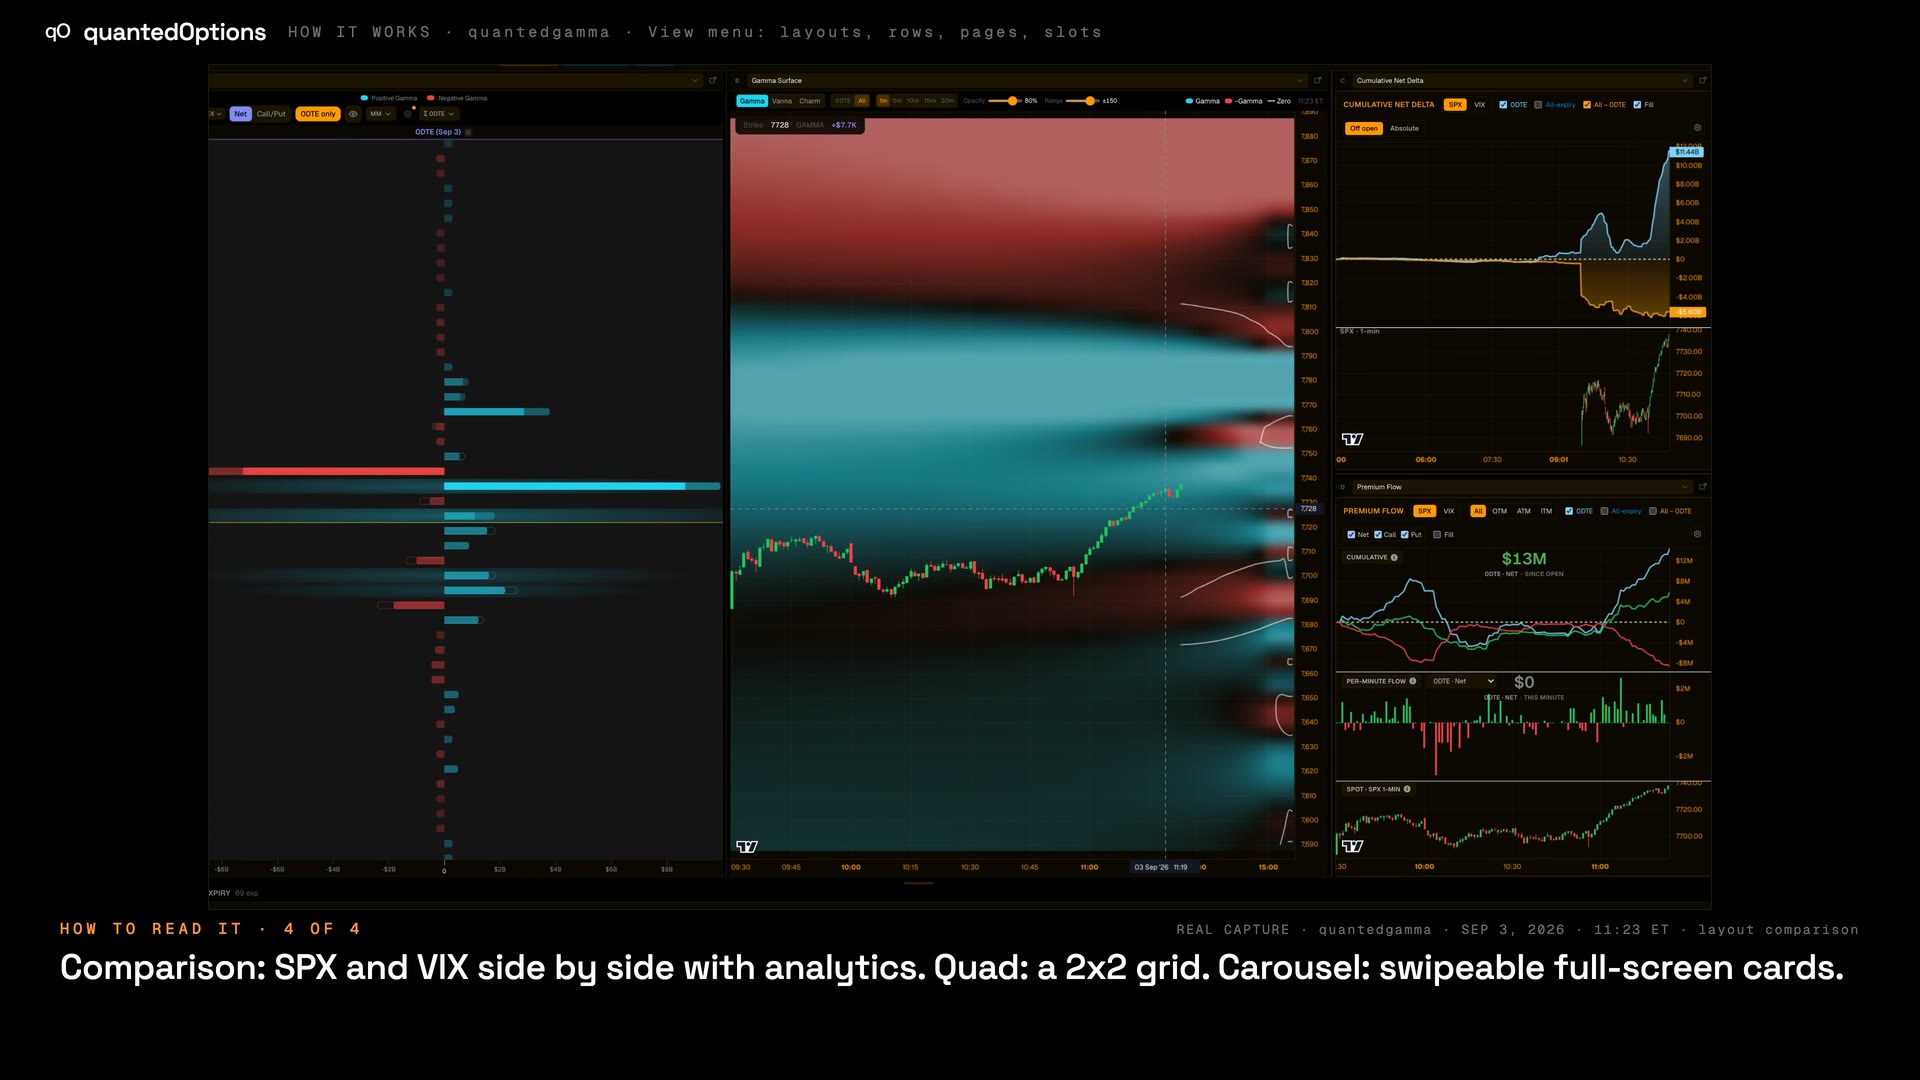
1:19View menu: layouts, rows, pages, slots
Choose how many panels you see and which widget sits in each.
 0:58
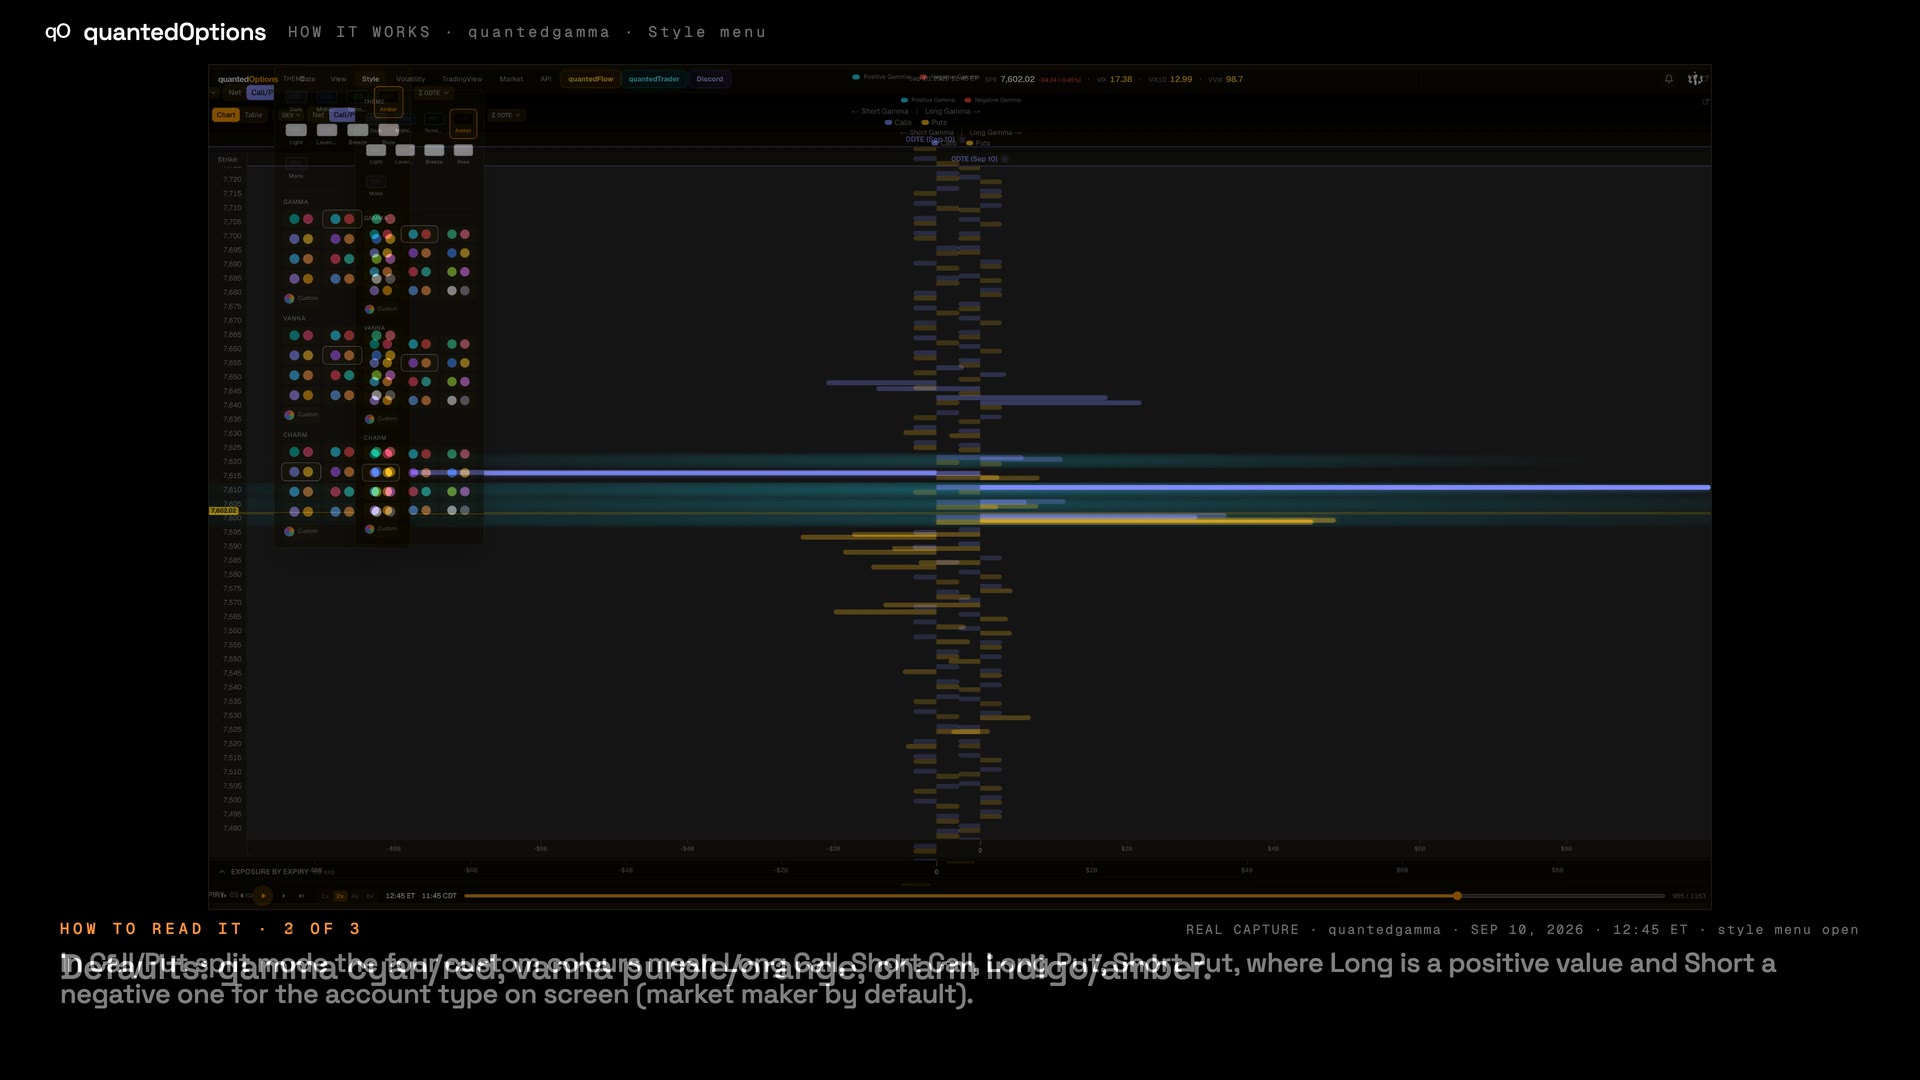
0:58Style menu
Dashboard theme and the positive/negative colours for gamma, vanna and charm.
 0:47
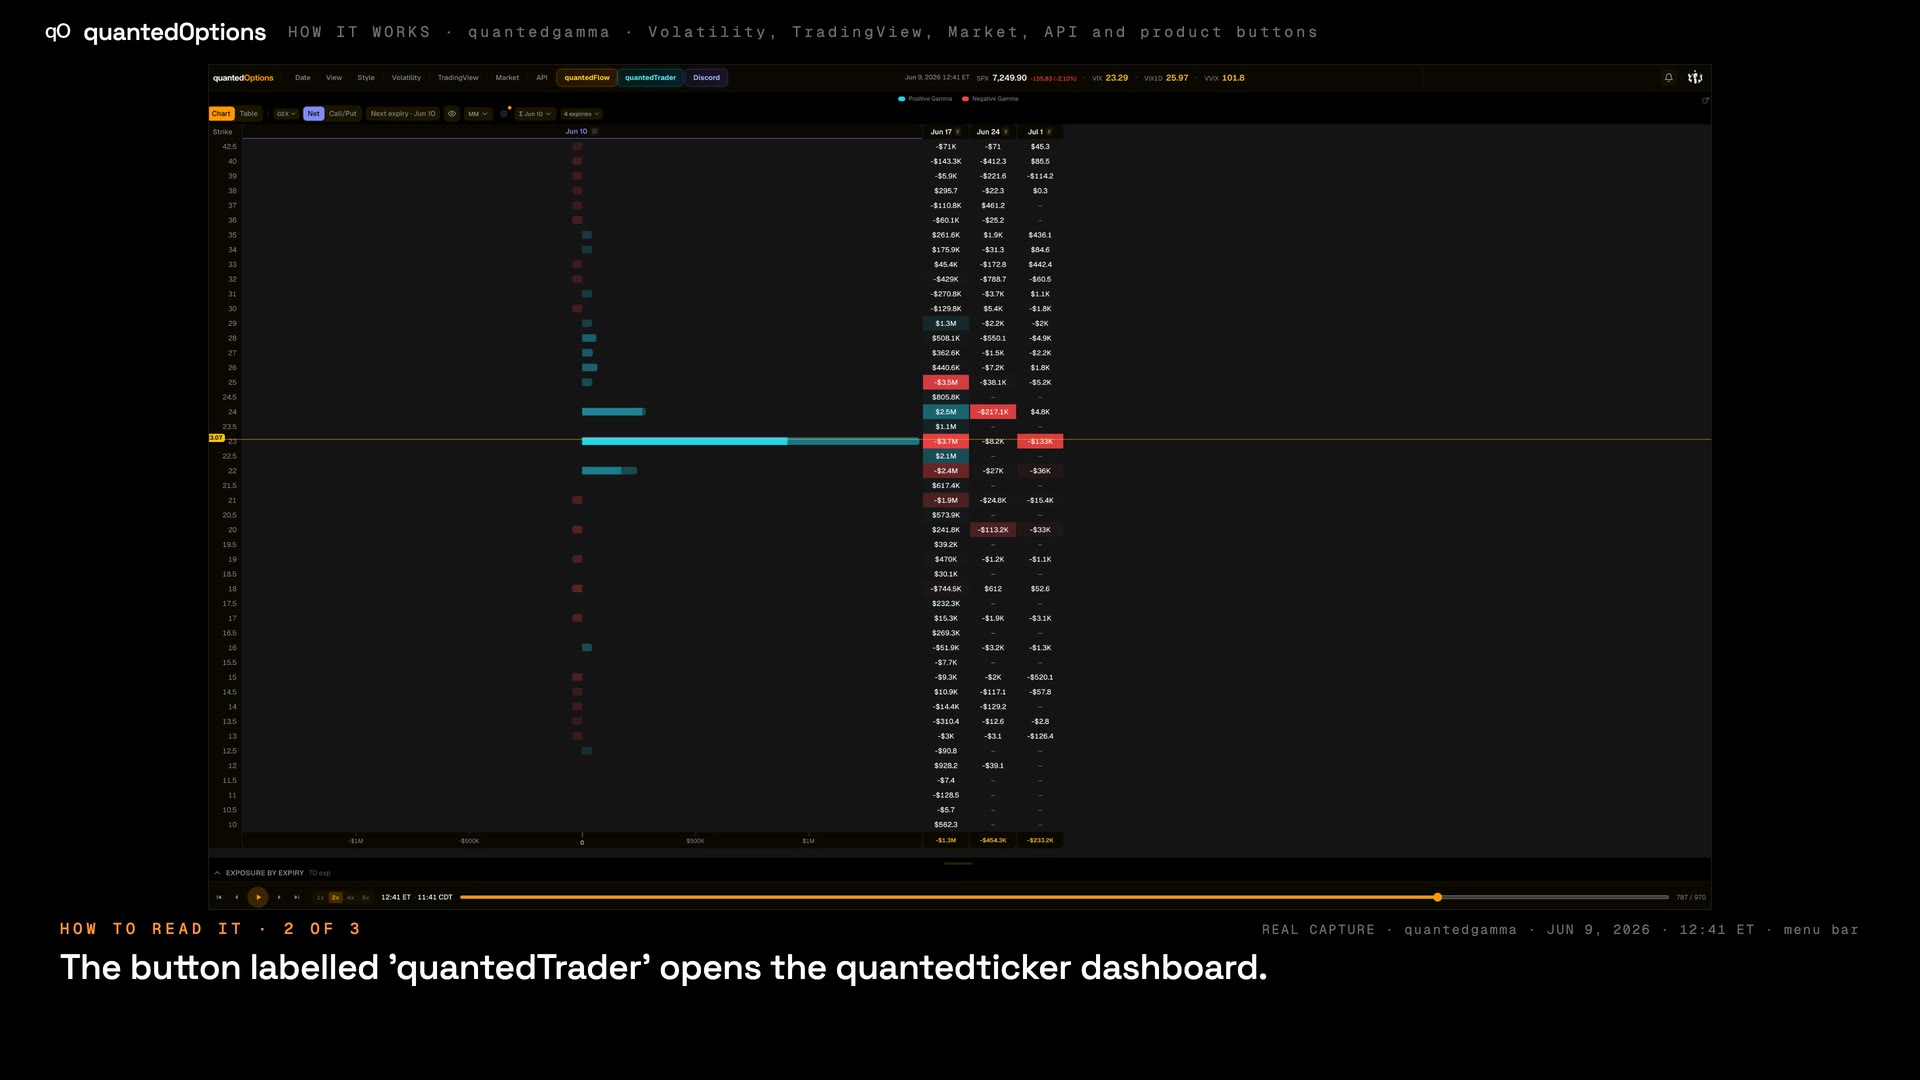
0:47Volatility, TradingView, Market, API and product buttons
Buttons that open a sibling view or another product.
 1:02
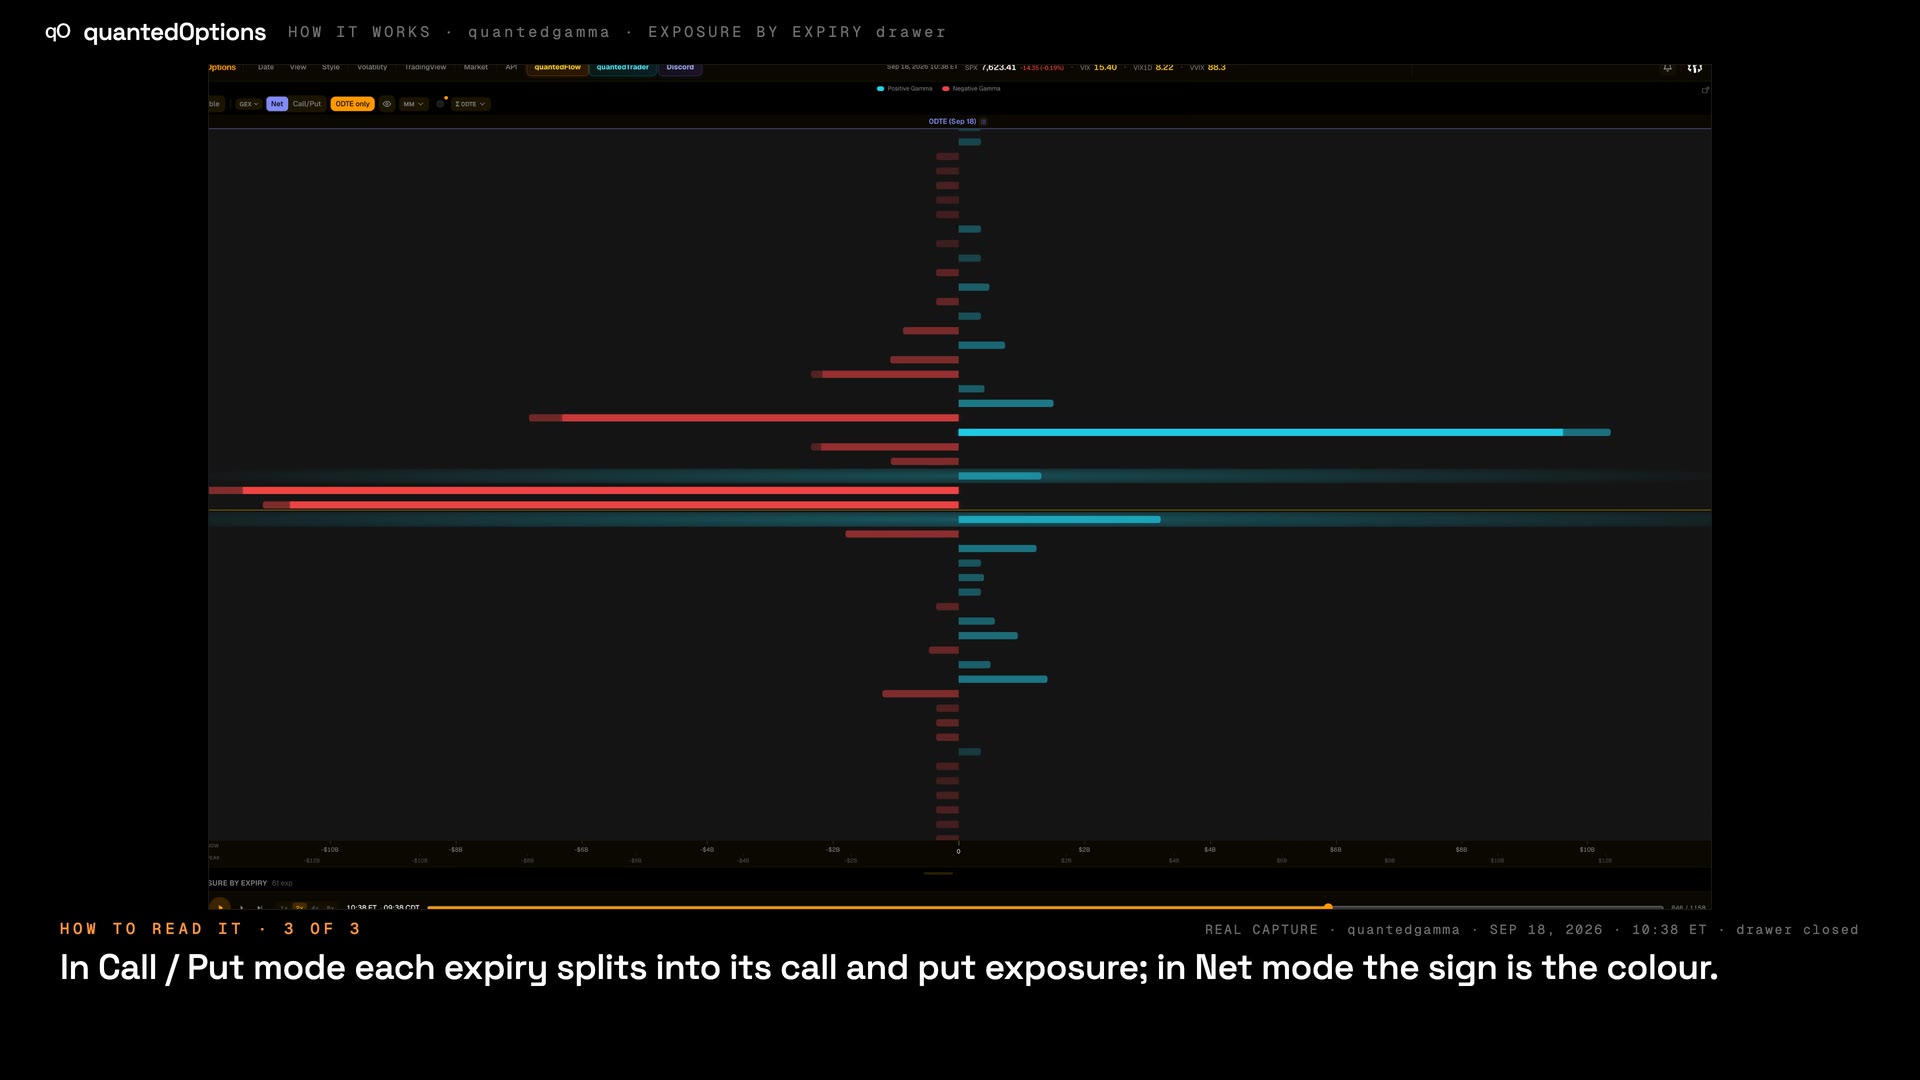
1:02EXPOSURE BY EXPIRY drawer
A pull-up drawer showing how much gamma sits in each expiry.
QQQ, SPY, IWM, DIA and hundreds of equities
quantedTicker
Computed from data consolidated across every US options exchange: open interest and volume.
The reading order
- 01Regime — Session strip: the Net gamma tile, 0DTE against all expiries.
- 02Ladder — Strike Profile: the walls and the flip are read off these rows.
- 03Price and levels — Price x Gamma: the same levels drawn as lines and heat on price.
- 04Flow and delta — Net Delta, Premium Flow and Unusual Volume: where the dollars and the volume went today.
- 05Replay — Scrub or play any minute of any stored day; every widget on the page follows.
 1:11
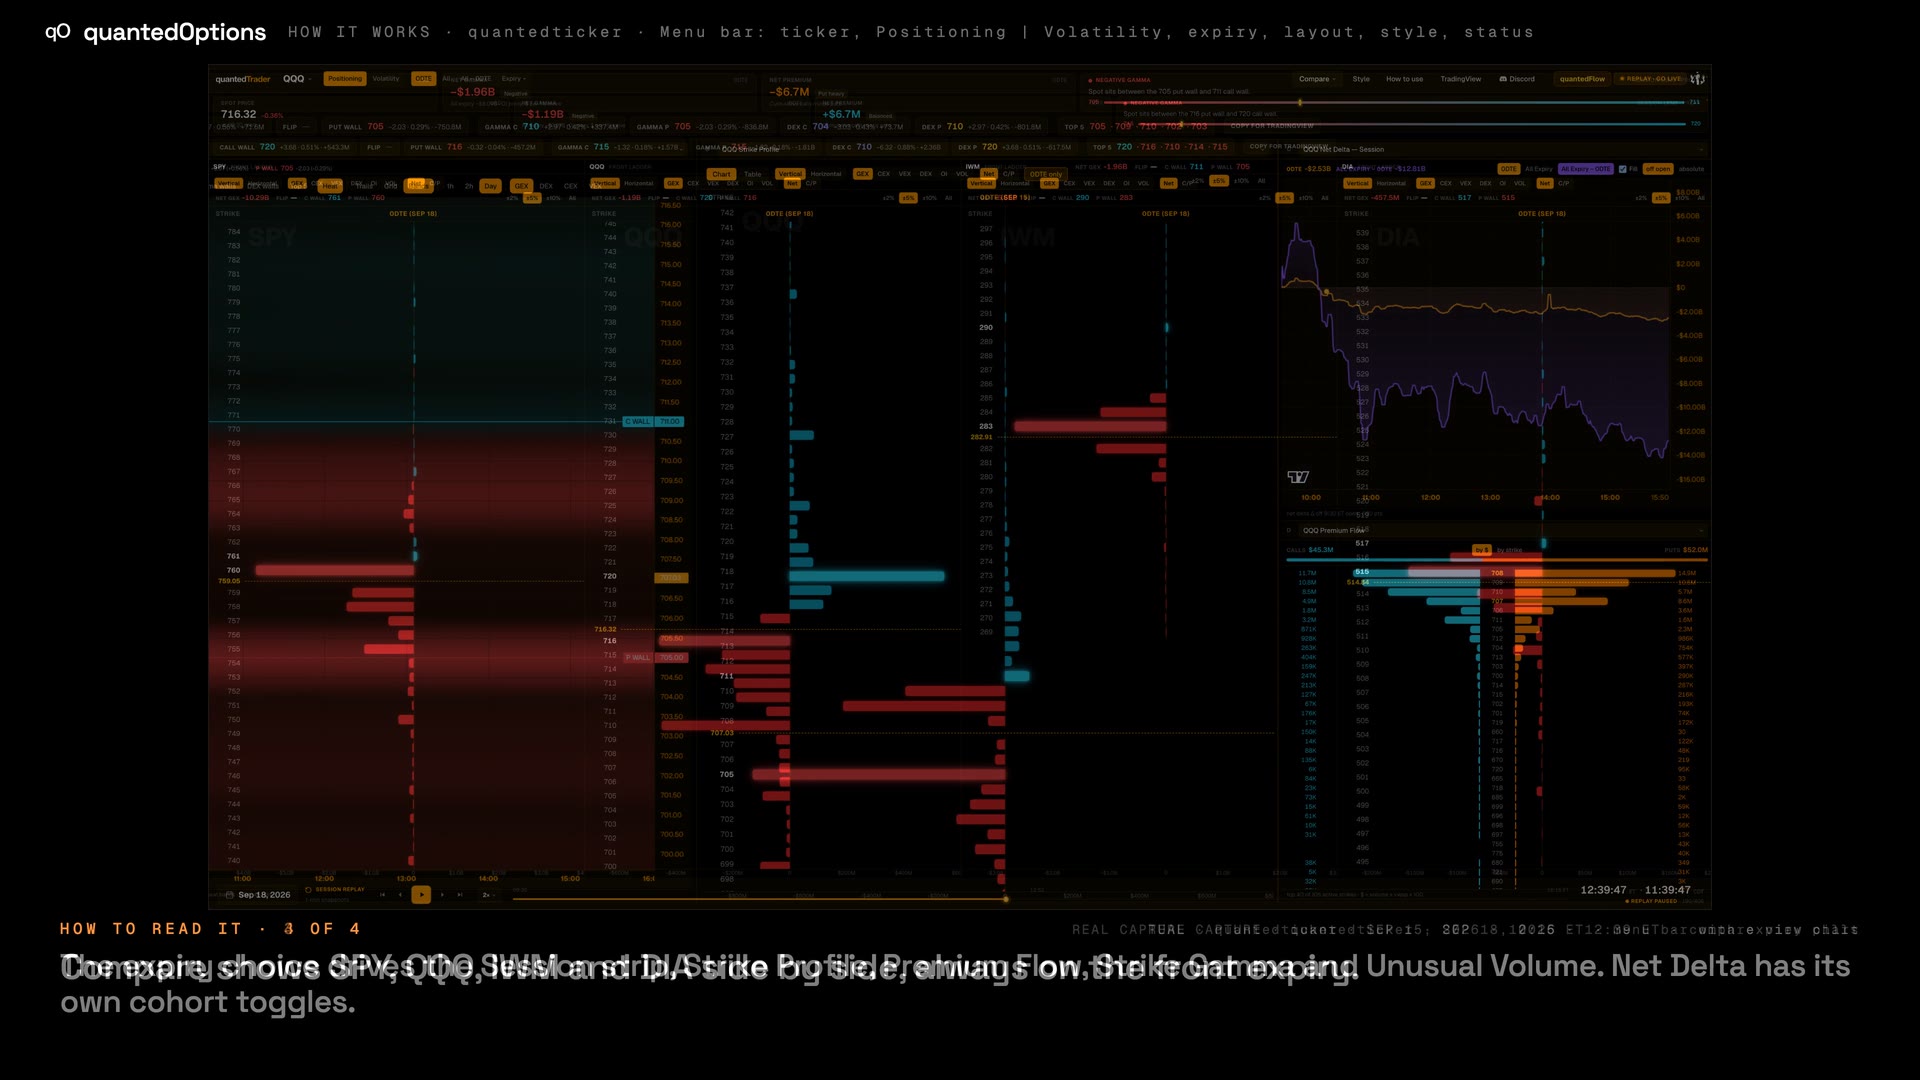
1:11Menu bar: ticker, Positioning | Volatility, expiry, layout, style, status
Pick the ticker, the expiry cohort and the layout; see whether you are live.
 1:00
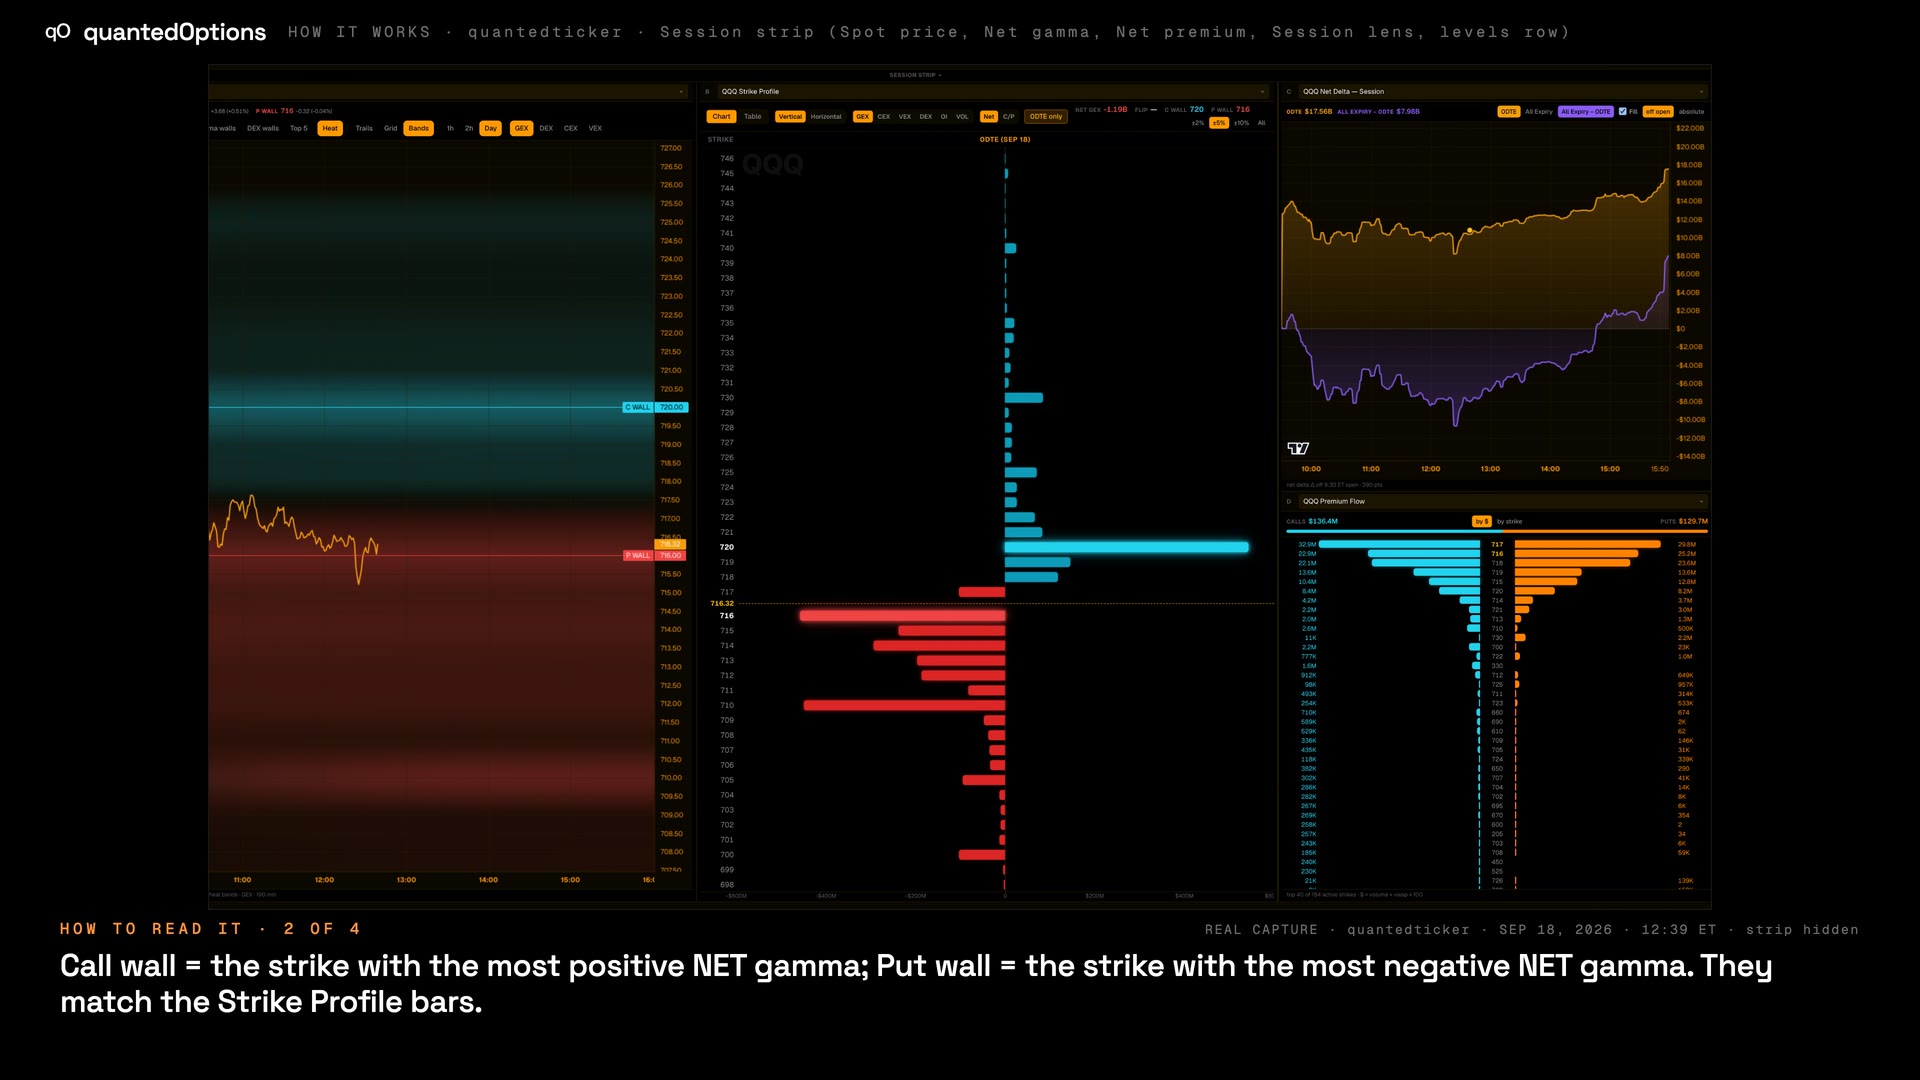
1:00Session strip (Spot price, Net gamma, Net premium, Session lens, levels row)
Four headline tiles and a row of level chips for the chosen ticker.
 1:08
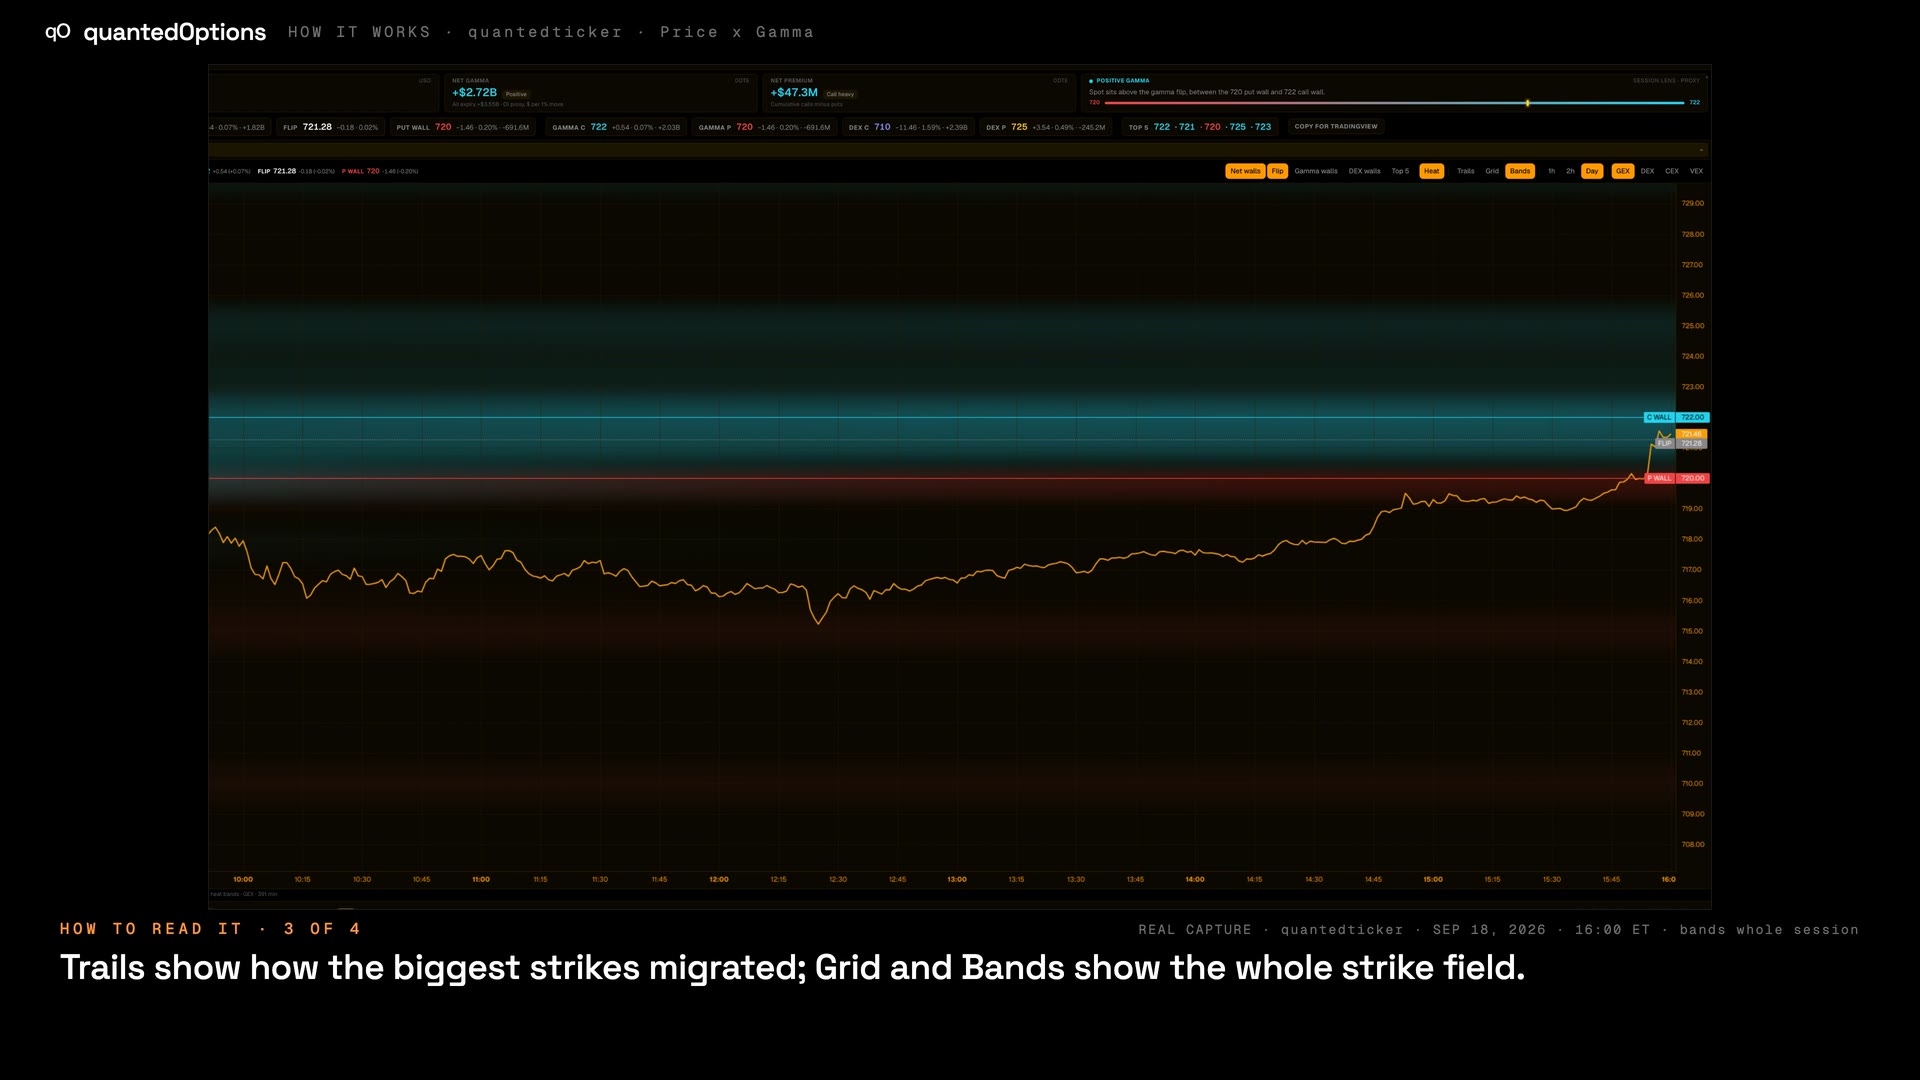
1:08Price x Gamma
The day's price line with gamma levels and a strike heat map behind.
 1:17
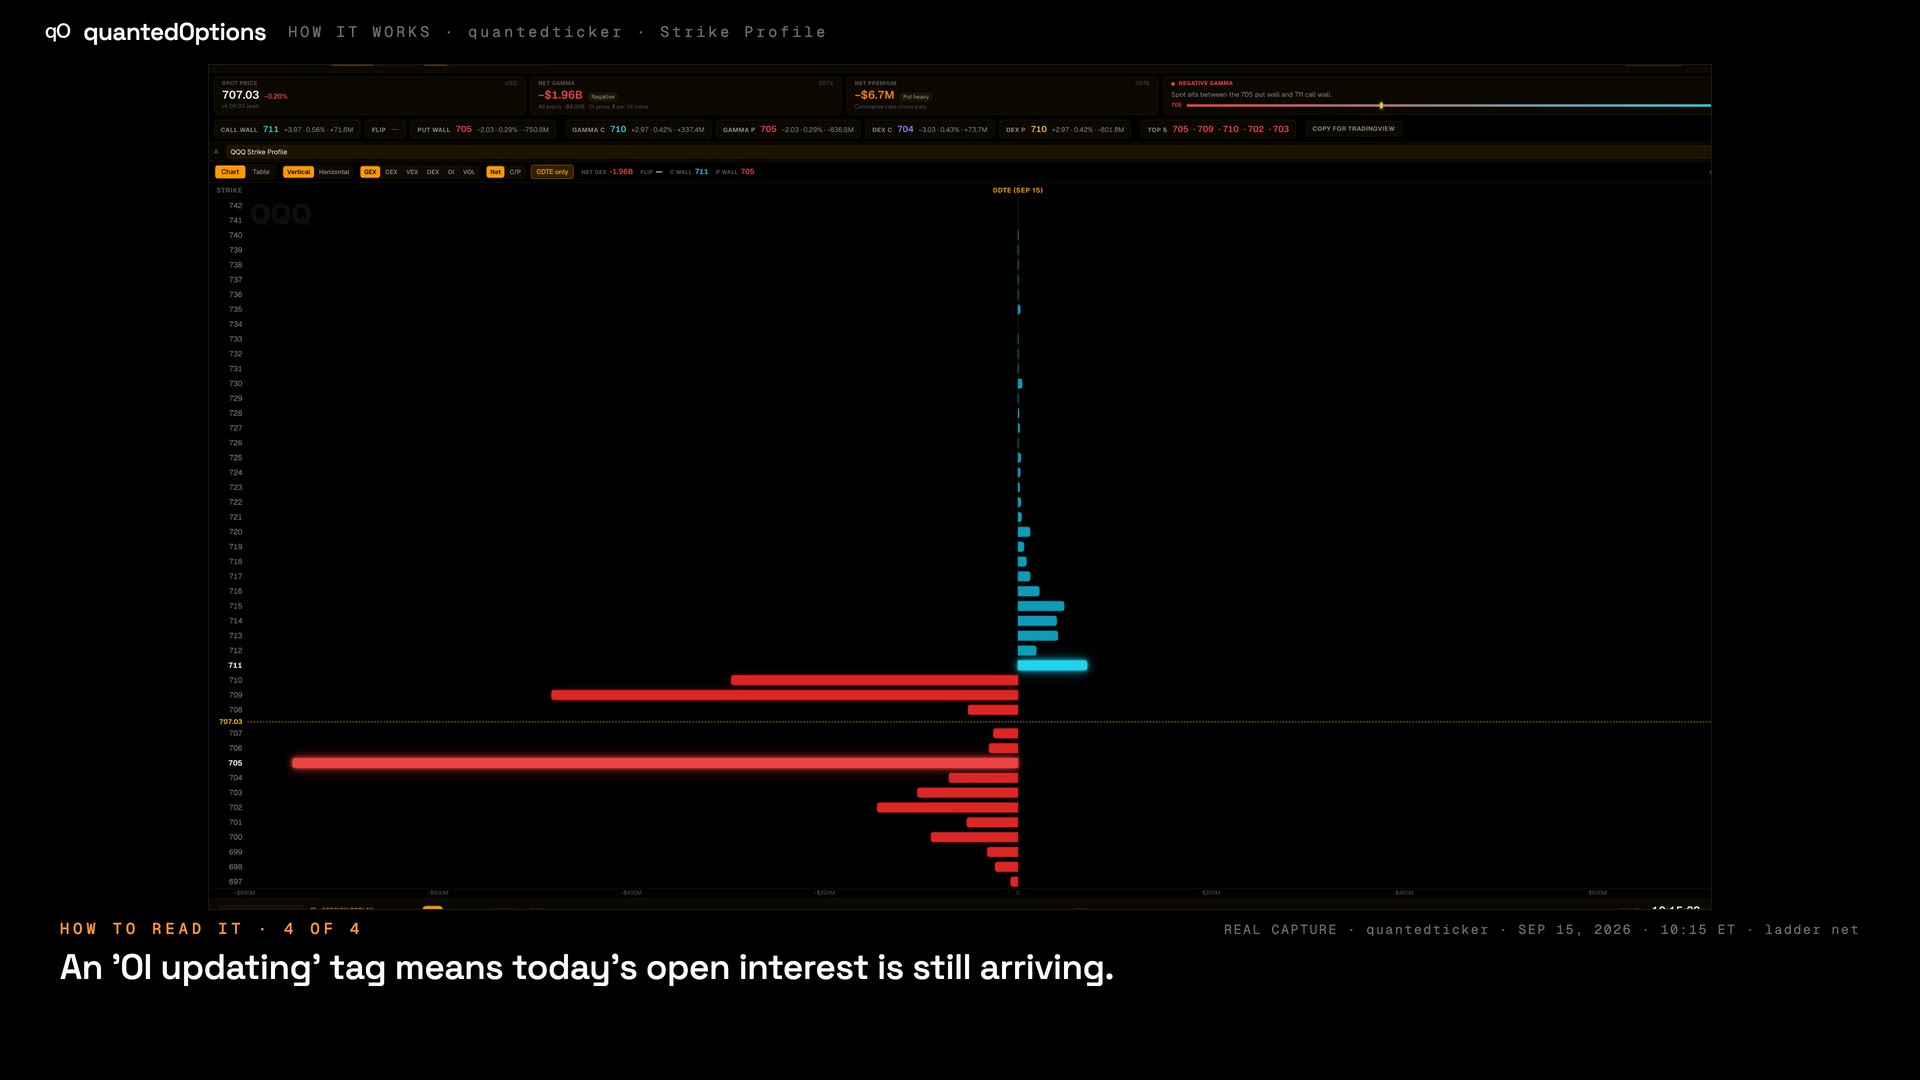
1:17Strike Profile
Exposure at every strike for the chosen ticker and expiry, built on open interest.
 1:02
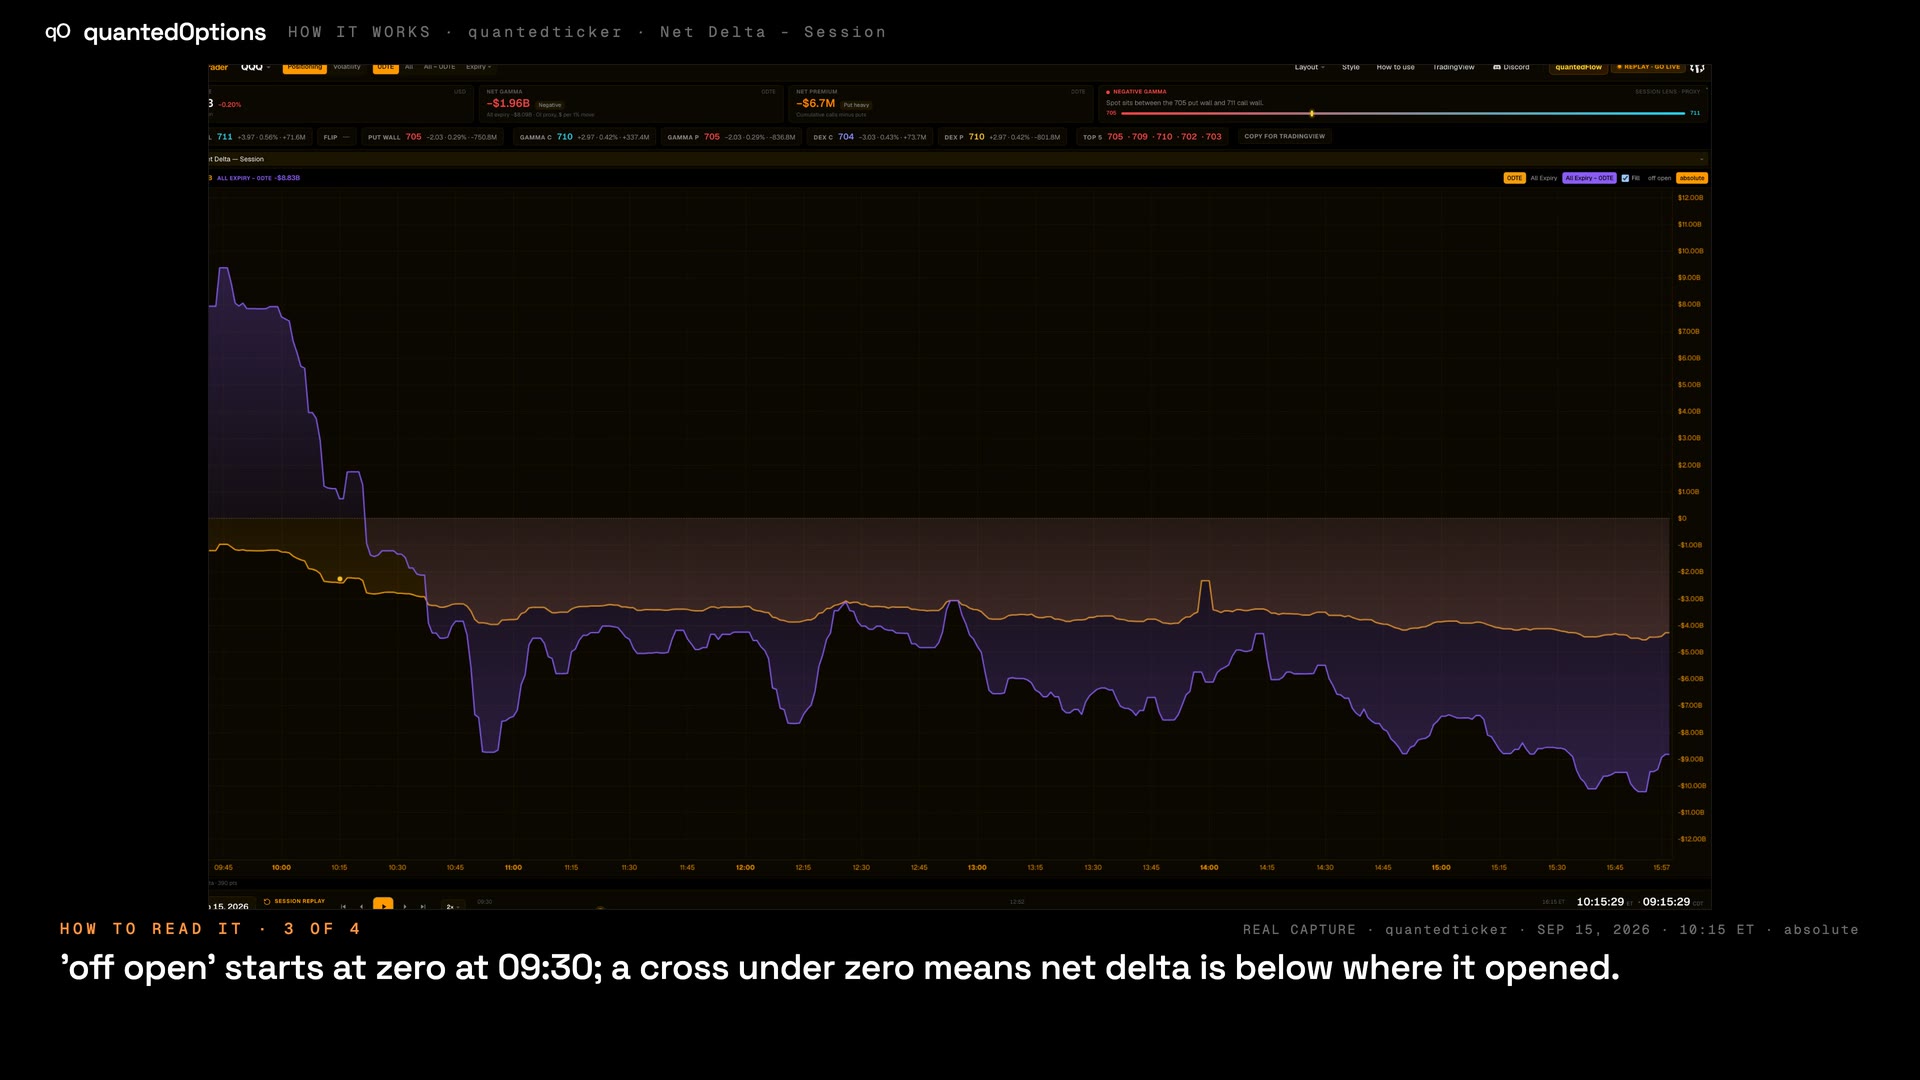
1:02Net Delta - Session
Net delta from open interest through the day, shown as change since 09:30.
 0:51
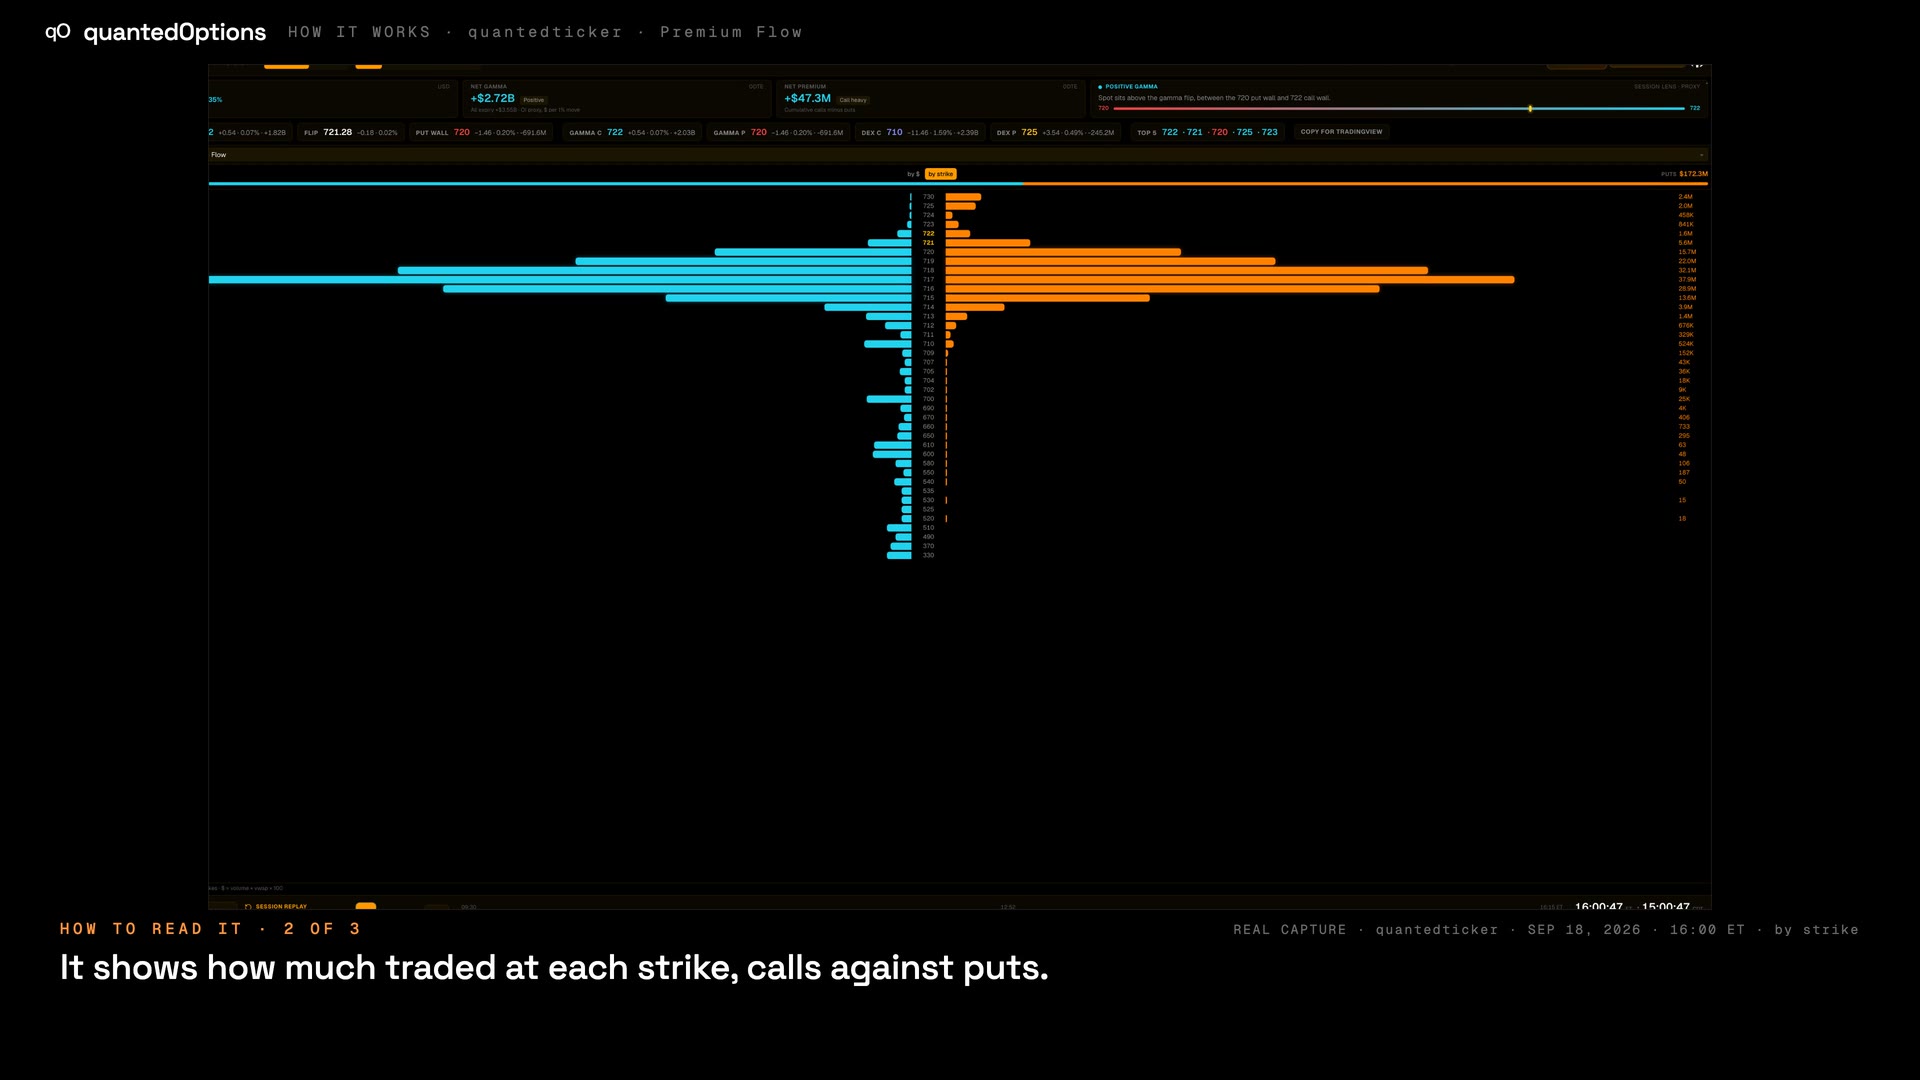
0:51Premium Flow
Dollars traded in calls versus puts at each strike so far today.
 0:52
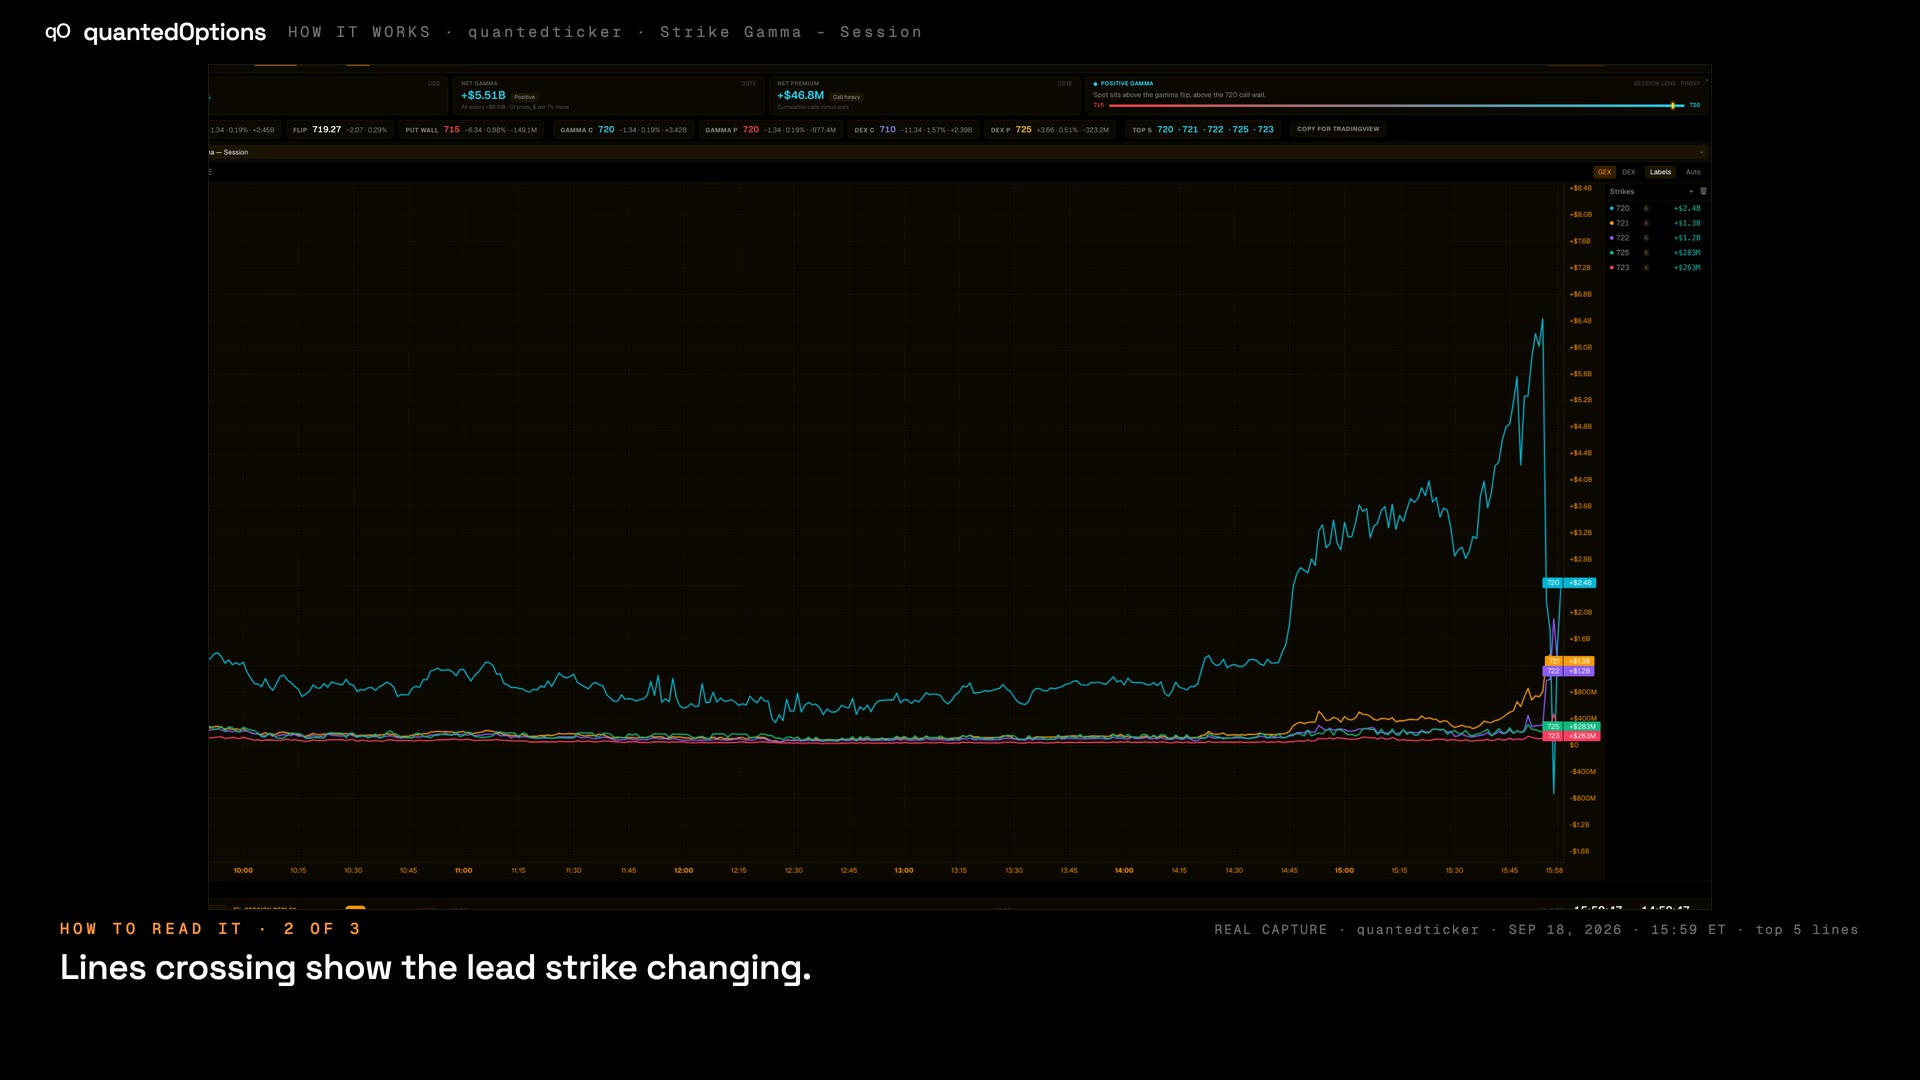
0:52Strike Gamma - Session
A line per strike showing its gamma or delta through the day.
 0:52
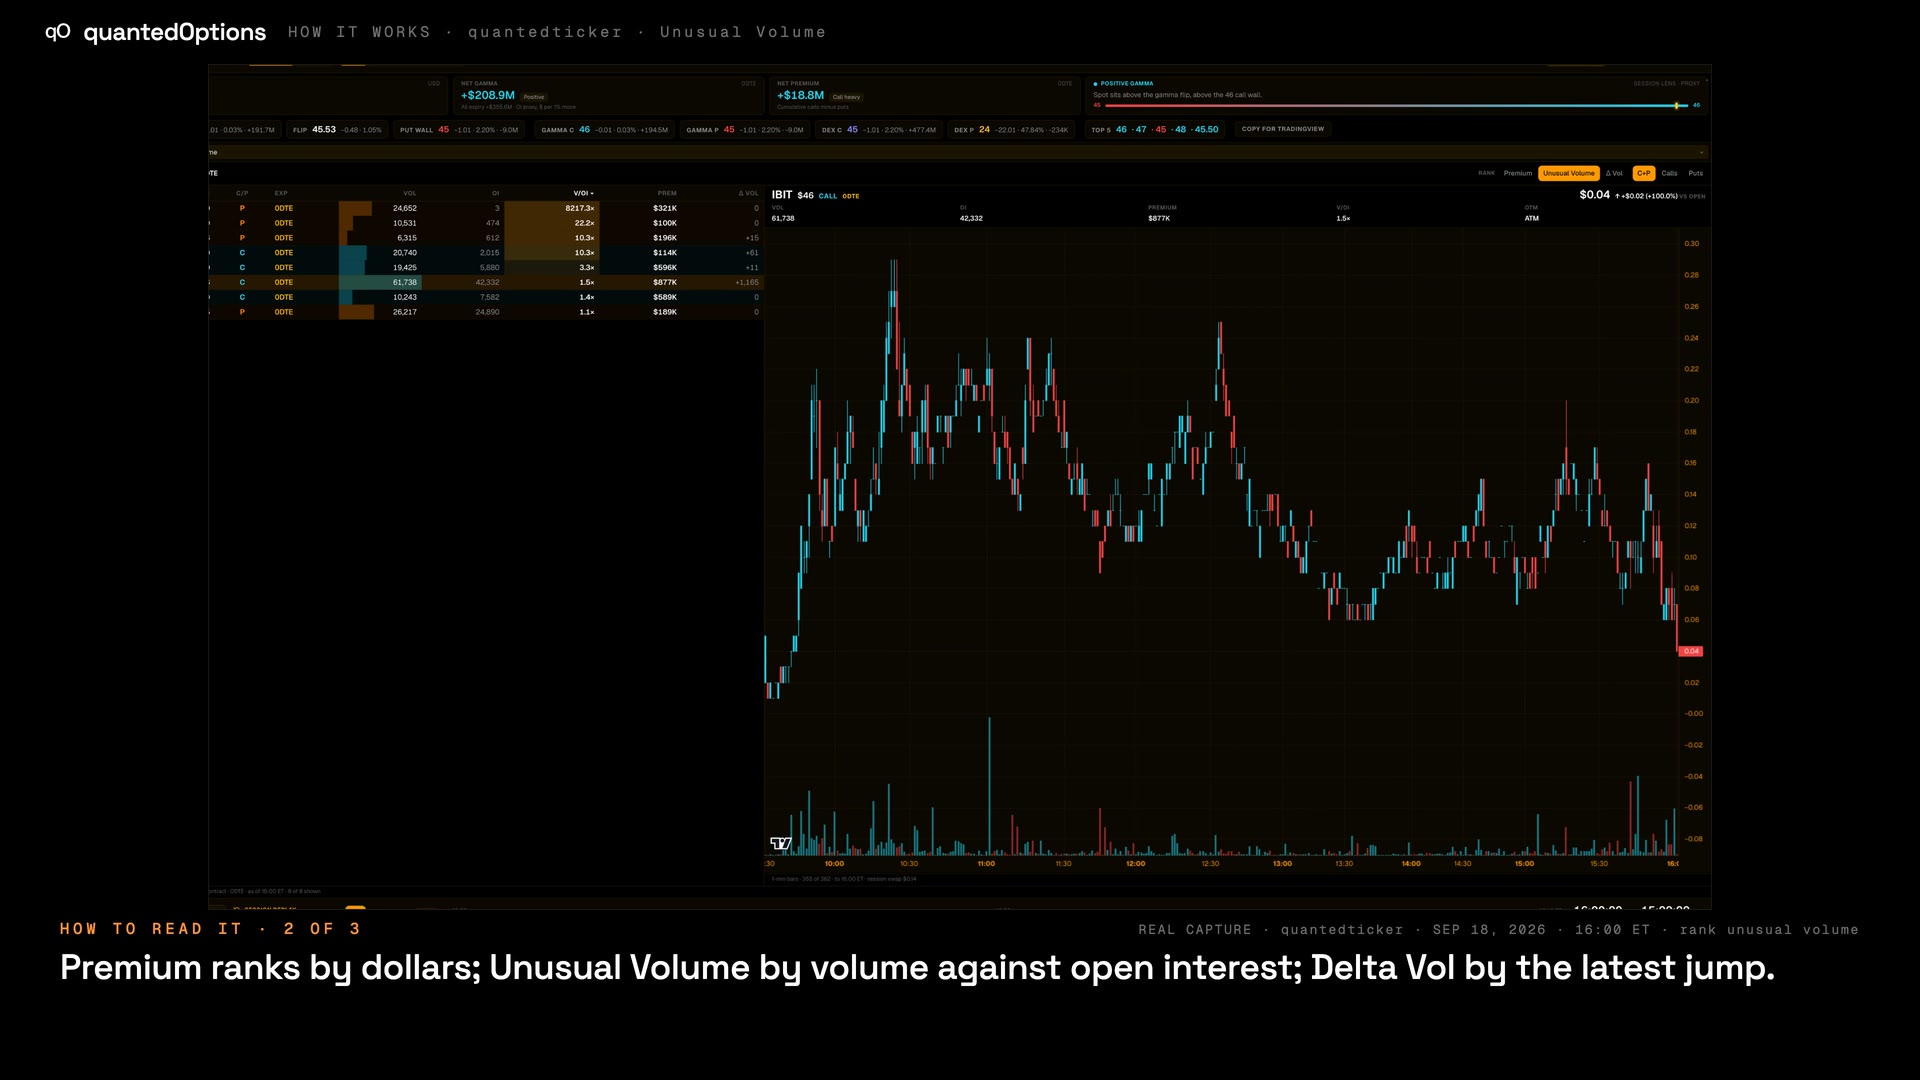
0:52Unusual Volume
Contracts whose volume today has reached their open interest.
 0:55
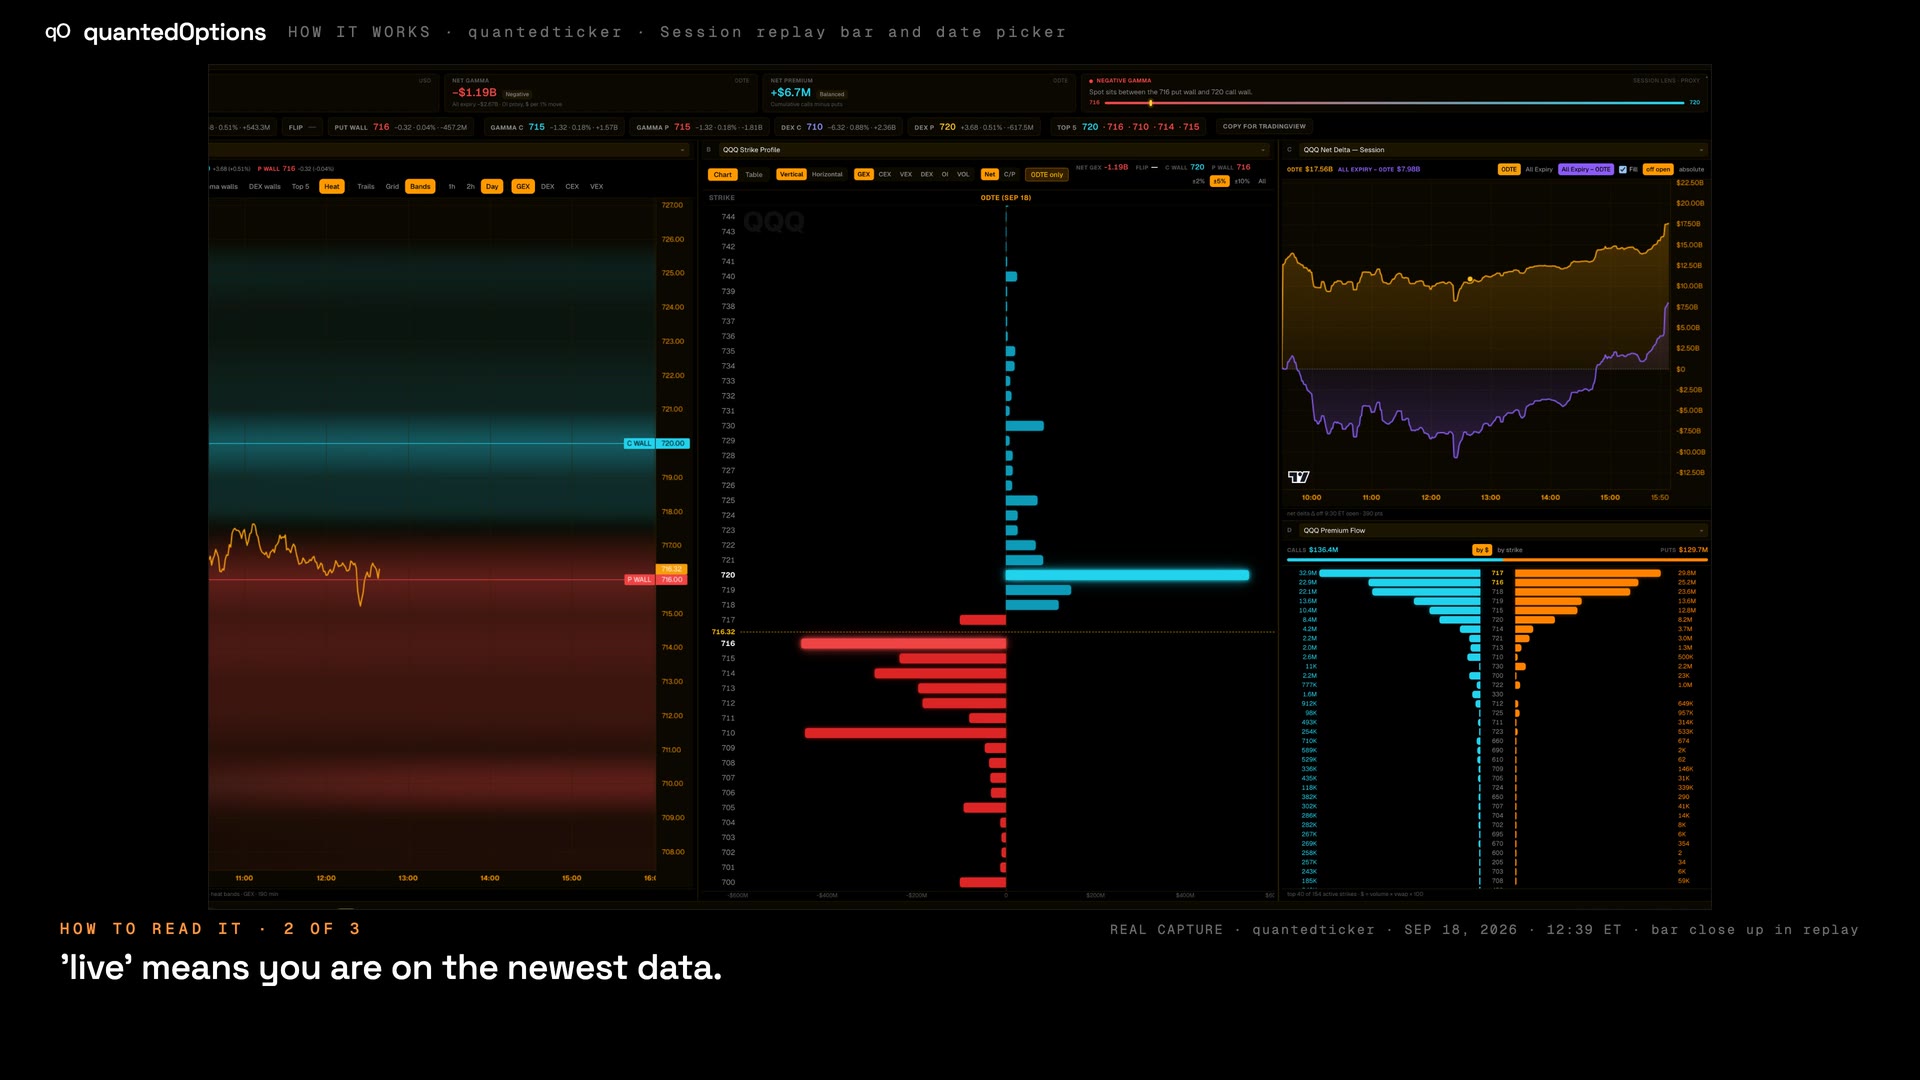
0:55Session replay bar and date picker
Pick a day, then scrub or play its one-minute snapshots.
 1:03
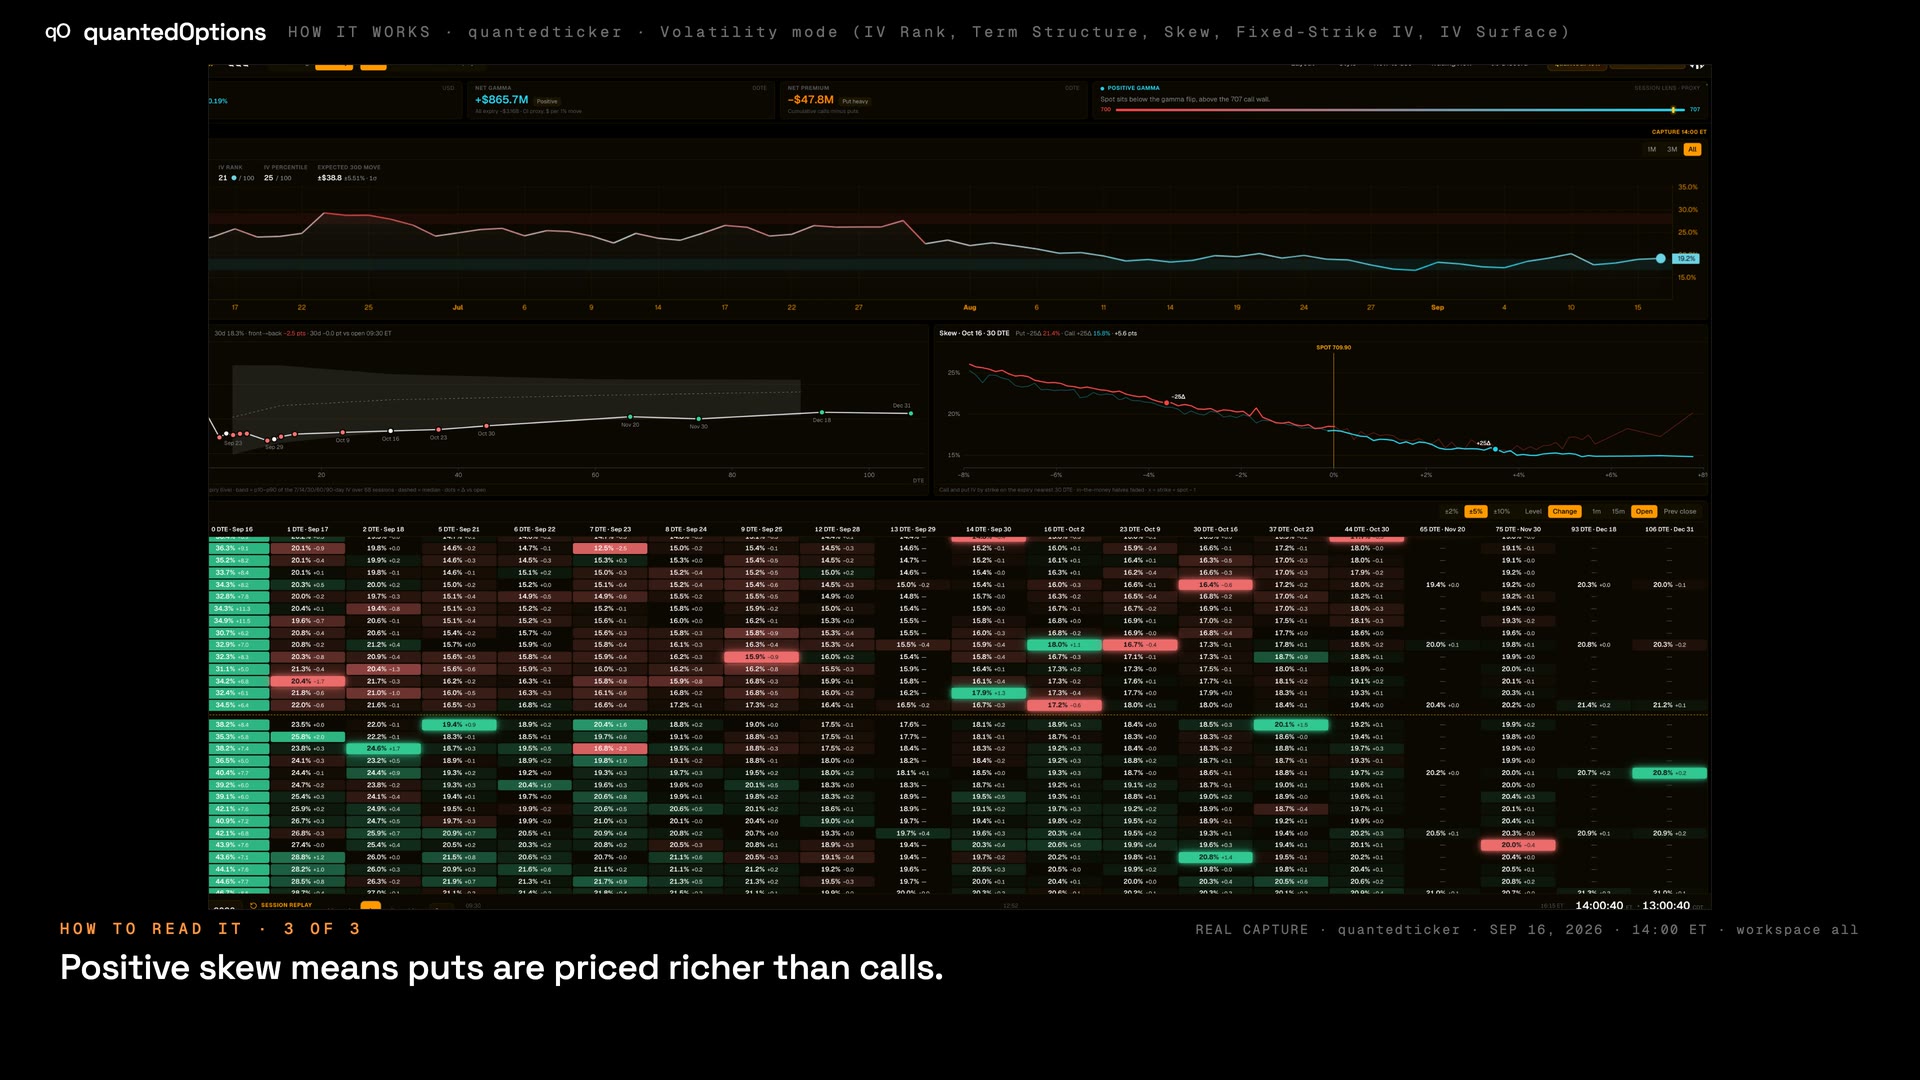
1:03Volatility mode (IV Rank, Term Structure, Skew, Fixed-Strike IV, IV Surface)
The ticker's implied volatility: where it ranks, by expiry, by strike.
Signs
Whose side is the number on?
On quantedGamma every exposure is read from the market maker's side: market maker long options = positive.
| Metric | Positive means | Negative means |
|---|---|---|
| Gamma (GEX) | Market makers are long gamma there. They buy dips and sell rips, so price slows or stops. | Market makers are short gamma there. Their hedging goes with the move, so price moves through. |
| Delta (DEX) | The market-maker book is net long delta. | The market-maker book is net short delta. |
| Charm (CEX) | Suppressive — "wind in your face". | Supportive — "wind at your back". |
| Vanna (VEX) | Market-maker delta rises if implied volatility rises. | Market-maker delta falls if implied volatility rises. |
| Premium Flow | The market maker bought that premium. | The market maker sold that premium. |
| Cumulative Net Delta / Gamma | As delta / gamma above, for the whole book. | As delta / gamma above, for the whole book. |
- Charm is the easiest sign to read backwards: negative is supportive.
- On the Strike Profile the account type picker can switch the bars to Firm, BD, Cust or Pro. Everything else on the page stays on the market maker's side.
On quantedTicker the numbers are built on open interest and volume:
| Metric | What it shows |
|---|---|
| Gamma (GEX) | Call gamma counts as positive and put gamma as negative. A positive strike is one where call open interest is the heavier side; a negative strike, put open interest. |
| Delta (DEX) | Delta keeps its natural sign: calls positive, puts negative. |
| Charm, Vanna (CEX, VEX) | The same open interest, read through charm and vanna. |
| Premium | Dollars traded in calls against puts today; net premium is calls minus puts. |
| Unusual Volume | Contracts whose volume today has reached their open interest: new activity. |
Open interest updates overnight, so through the session these levels move with price, time and implied volatility.
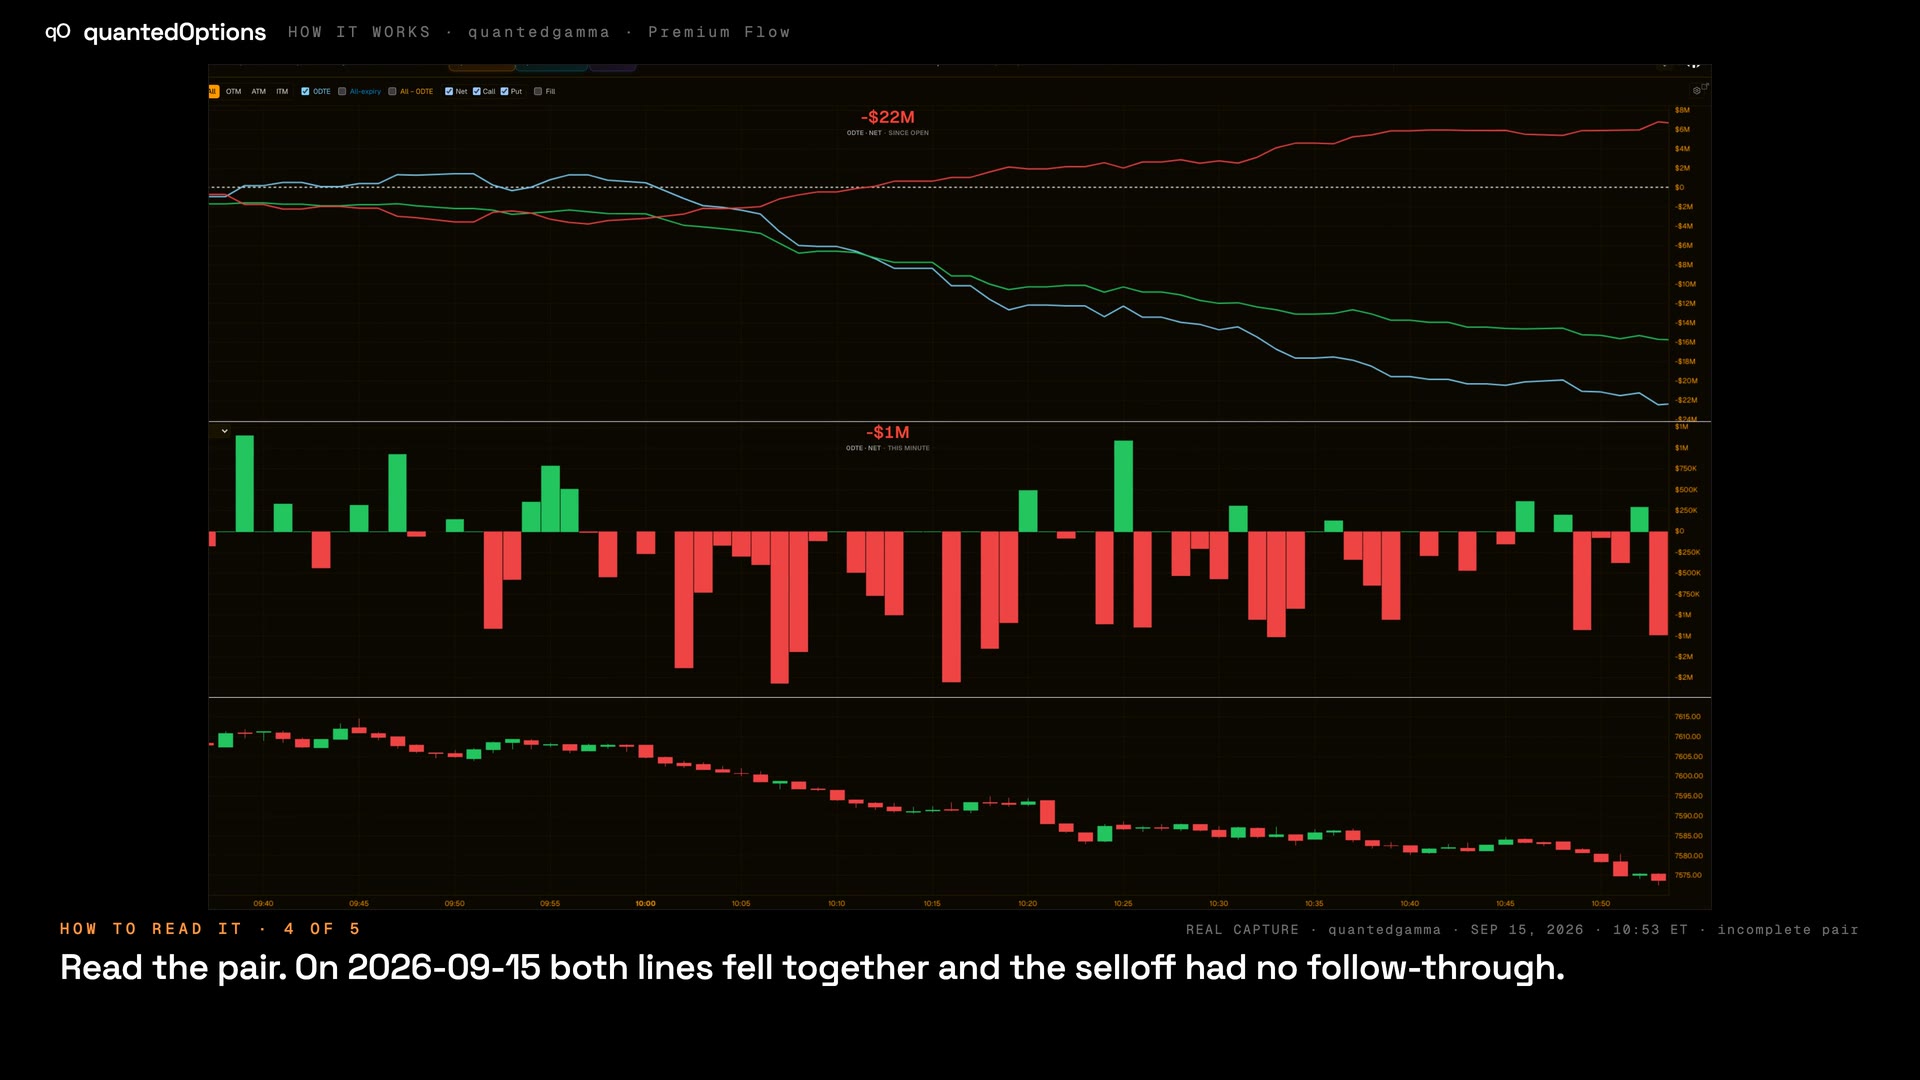
Premium Flow
The market-maker view
The Premium Flow widget on quantedGamma is the market maker's book. A rising call line is market makers buying calls; a falling put line is market makers selling puts — and that is the side that lines up with what price does.
Read the explanationThese pages describe what the displays show and what the data did on the sessions shown. They are not trading advice, and a past session is not a forecast of a future one.