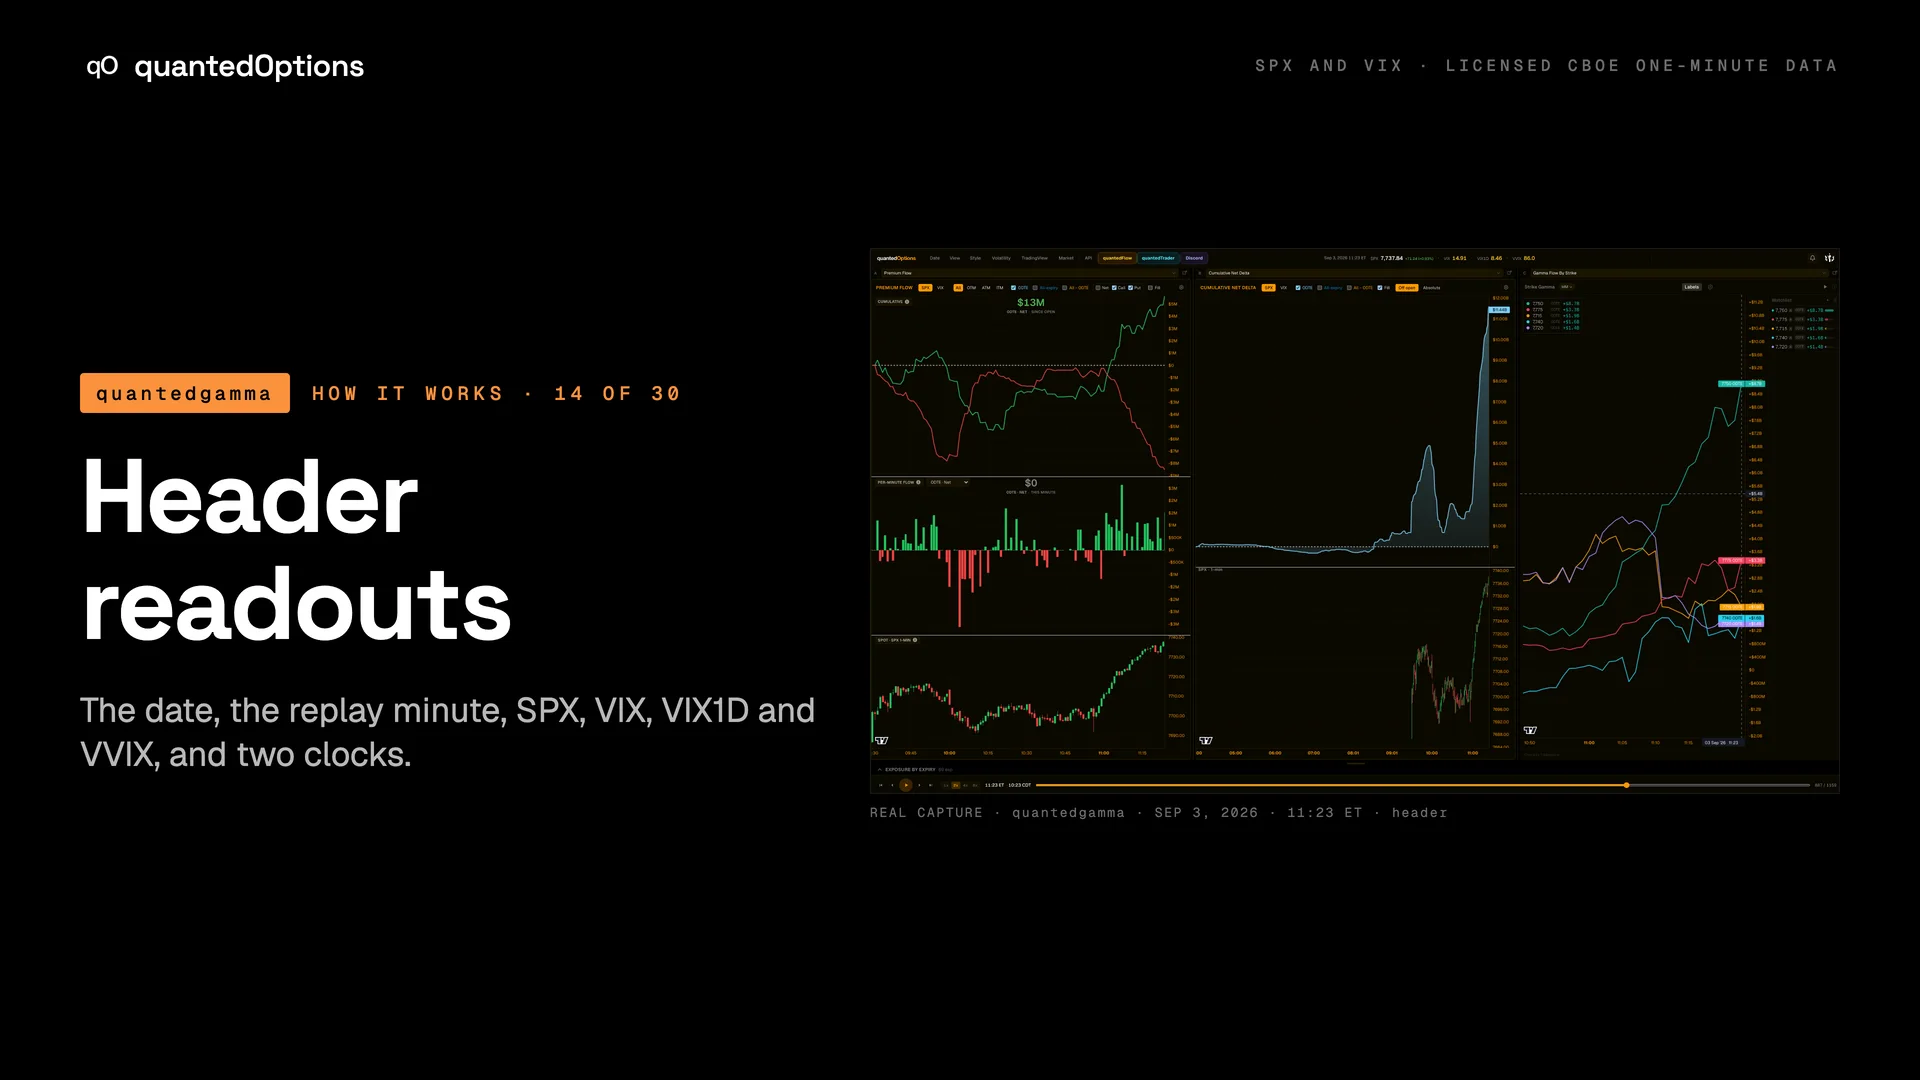
Header readouts
The date, the replay minute, SPX, VIX, VIX1D and VVIX, and two clocks.
What it shows
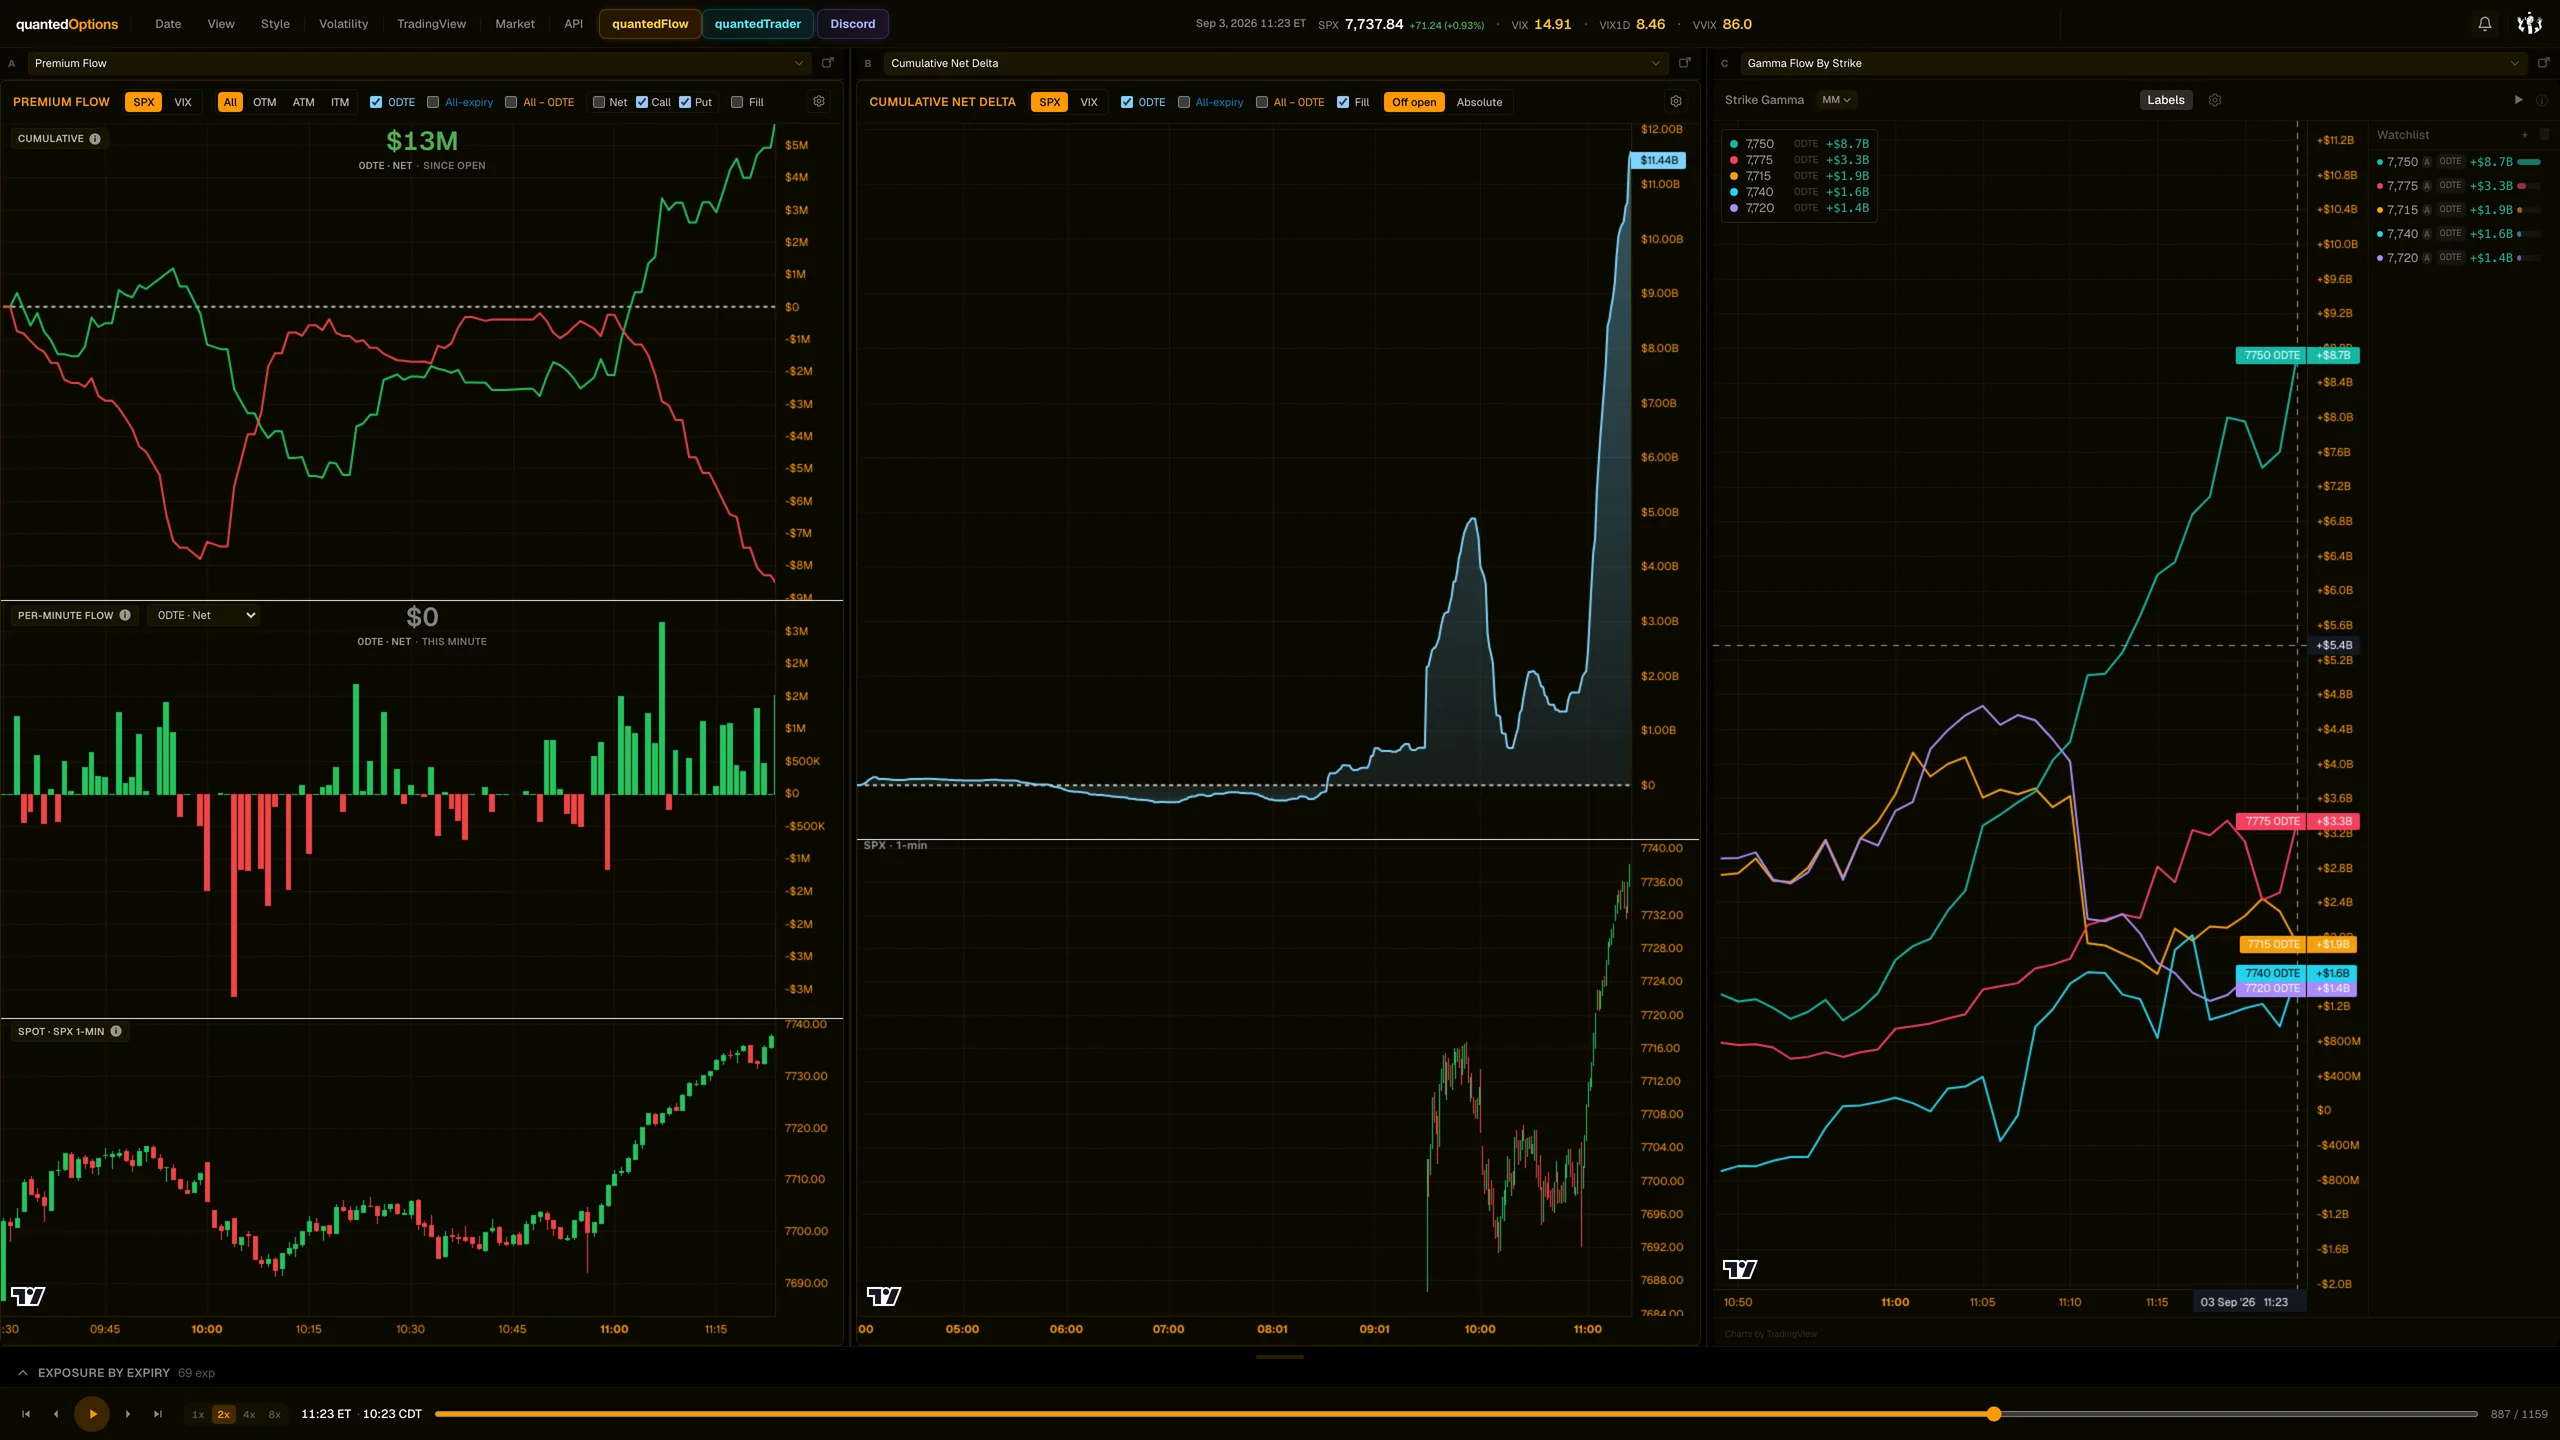
Left to right: the session date and the minute on screen in ET; the SPX (or VIX) price with its change and percent change; VIX, VIX1D and VVIX; then the wall-clock ET time with your own local time under it. When you scrub back, every value is the value at that minute.
What it is built from
The session's own index values at the minute on screen: SPX, VIX, VIX1D and VVIX from Cboe index data.
Reading
How to read it
- 'Sep 3, 2026 11:23 ET' is the minute every widget on the page is showing.
- The right-hand ET clock is the real time now; it stays on the present while you scrub.
- If the two disagree, you are in replay.
- VIX1D far below VIX is the usual state; the pair is how the case studies describe the volatility backdrop.
Controls
What each control does
| Control | Options | What it changes |
|---|---|---|
| Local time toggle (user menu) | on / off | Shows your own clock beside ET. |
| User menu: GEX alerts, dashboard scale | toggle; scale slider | Alert toasts on or off; overall UI scale. |
Read it with
- Replay bar — the bar's clock and this header always show the same minute
Good to know
- The change beside the price is measured from the start of the session, the evening before, so it includes the overnight move.
A real session
See it happen
11:23 ET
Header reads 'Sep 3, 2026 11:23 ET SPX 7,737.84' - the in-frame proof of date and minute.
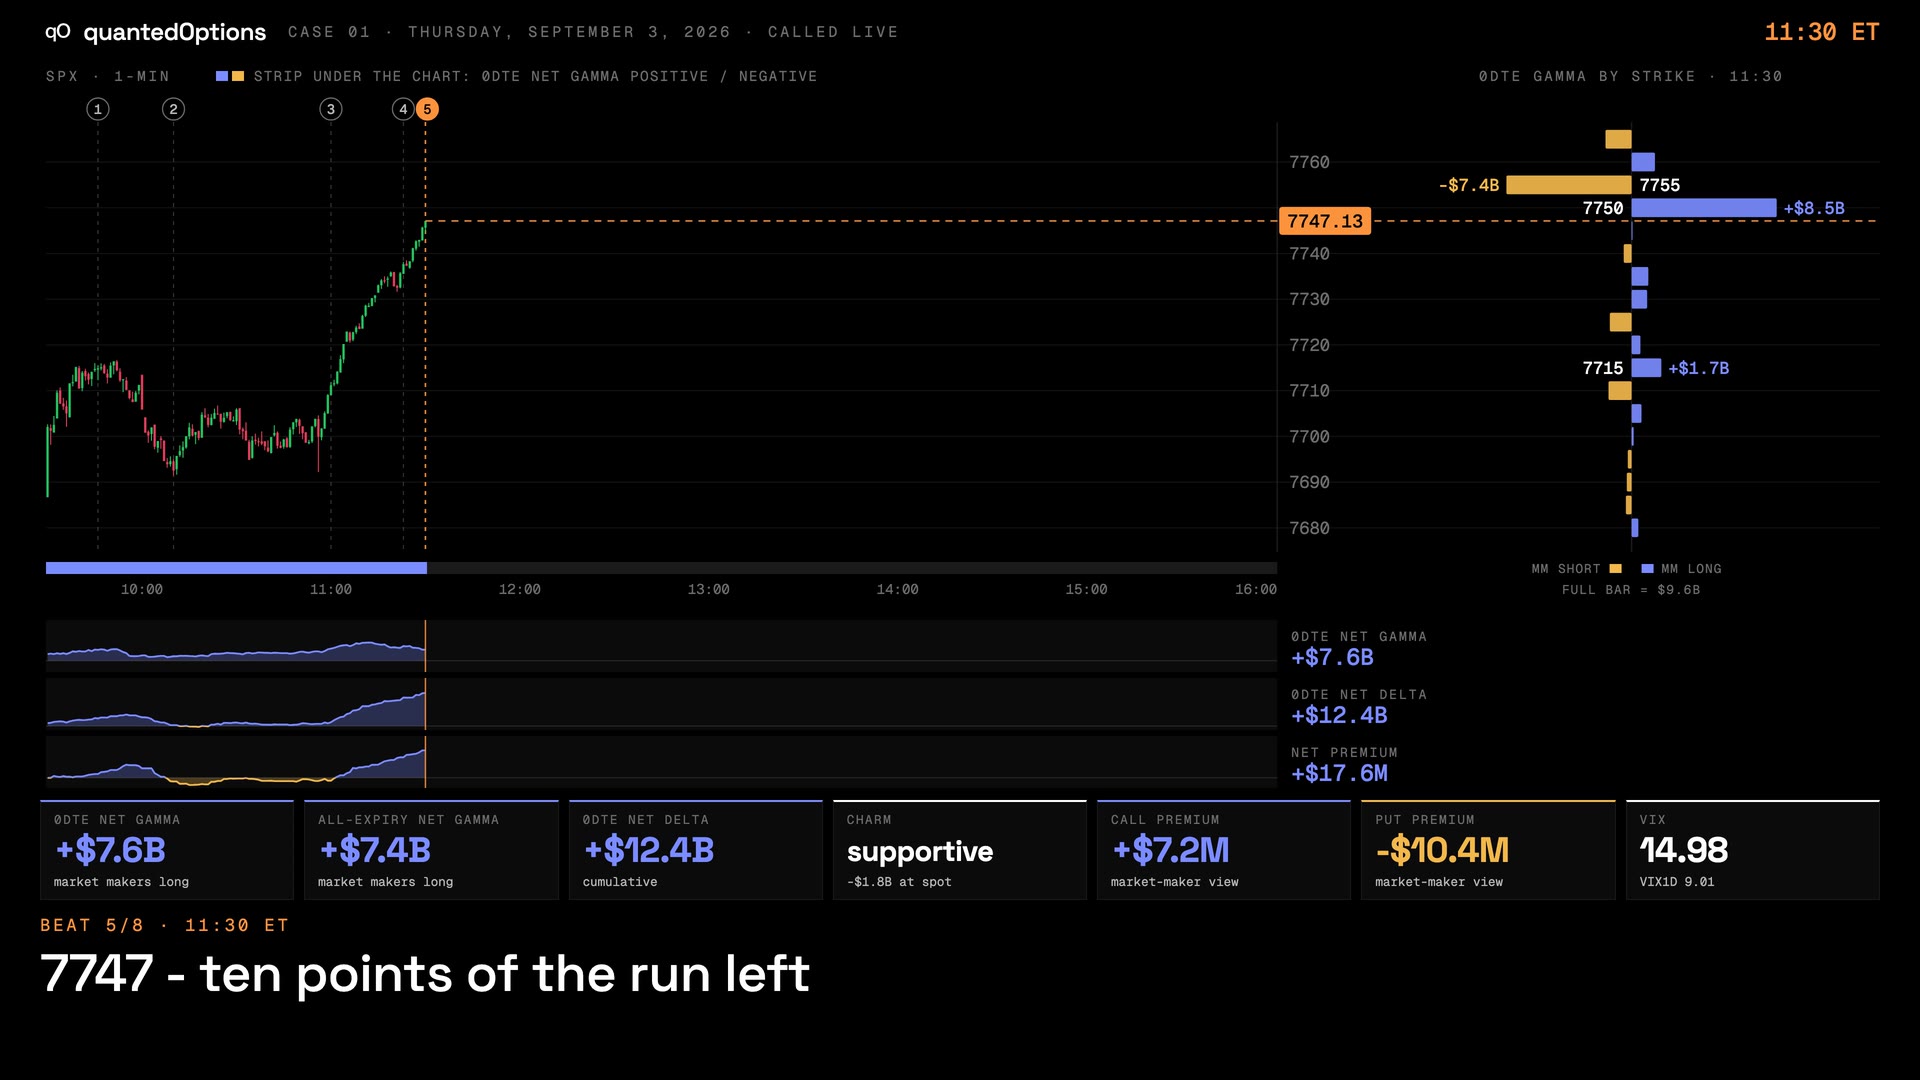
Case 01 · Sep 3, 2026
Calls bought, puts sold, net delta at the highs: the run to 7750
11 slides
The walk-through, slide by slide
Slide 1 / 11
From the product
Real frames
Shot off the live product, nothing redrawn. Click the right side of a frame for the next one, the left side to go back.
Product frame 1 / 2
These pages describe what the displays show and what the data did on the sessions shown. They are not trading advice, and a past session is not a forecast of a future one.