Volatility, TradingView, Market, API and product buttons
Buttons that open a sibling view or another product.
What it shows
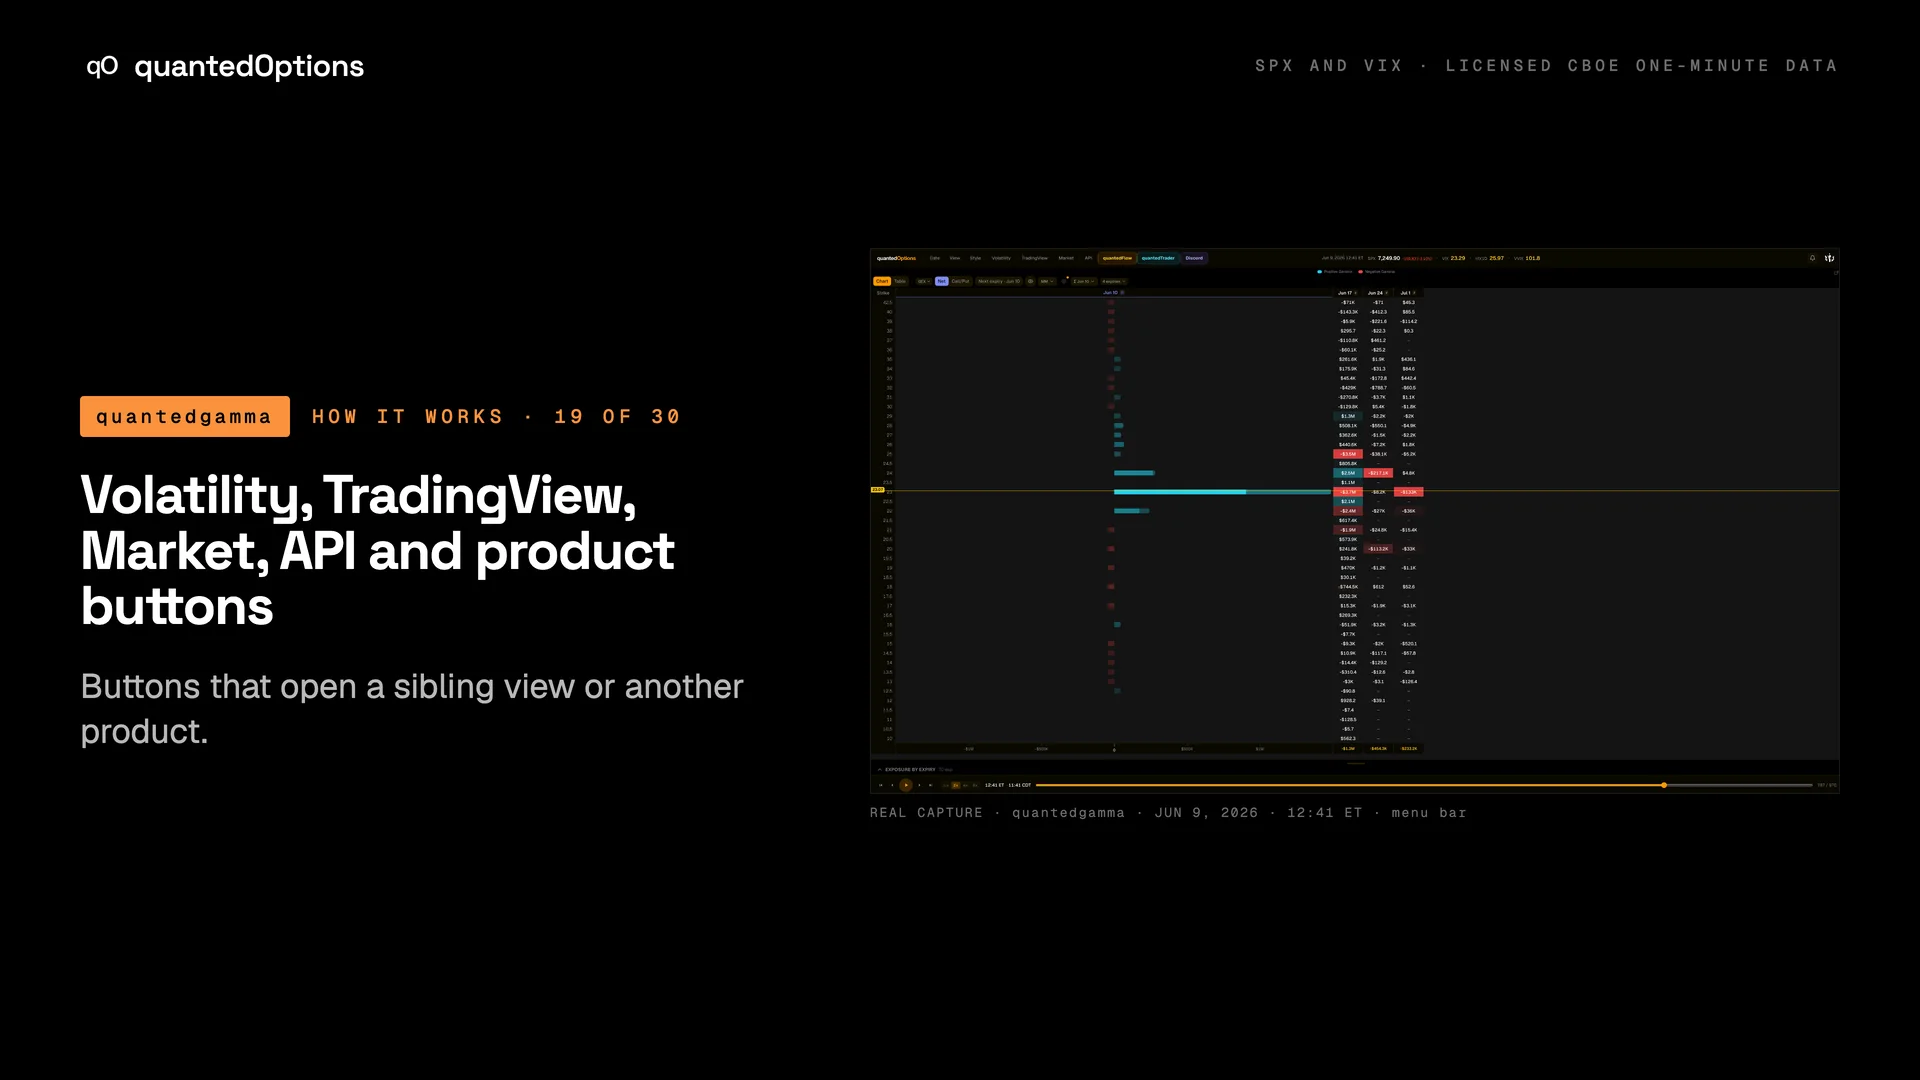
'Volatility' opens the SPX Volatility page in a new tab ('IV surface, term structure, skew and fixed-strike IV for SPX'), with the same date picker and replay bar. 'TradingView' opens a dialog about the browser add-on that puts these SPX levels on TradingView charts. 'Market' opens a sidebar of Cboe indices by category. 'API' opens the API access page. 'quantedFlow' and 'quantedTrader' open those dashboards in new tabs; 'Discord' links the members server.
What it is built from
Navigation: each button opens another view of the same data or another quantedOptions product.
Reading
How to read it
- Volatility is a page of its own, with the same date picker and replay bar.
- The button labelled 'quantedTrader' opens the quantedTicker dashboard.
- Volatility, API, quantedFlow and quantedTrader open in a new tab, so the date, minute and layout you were on are kept.
Controls
What each control does
| Control | Options | What it changes |
|---|---|---|
| Market sidebar | Volatility, Indices, Rates, Sectors, Cross-Asset Vol, Single-Stock Vol, Correlation, Strategy Indices, VIX Futures, Settlement, Other | Collapsible groups of index quotes; clicking a symbol opens a pop-out chart. |
Read it with
A real session
See it happen
12:41 ET
Market sidebar > Volatility group during the VIX spike.
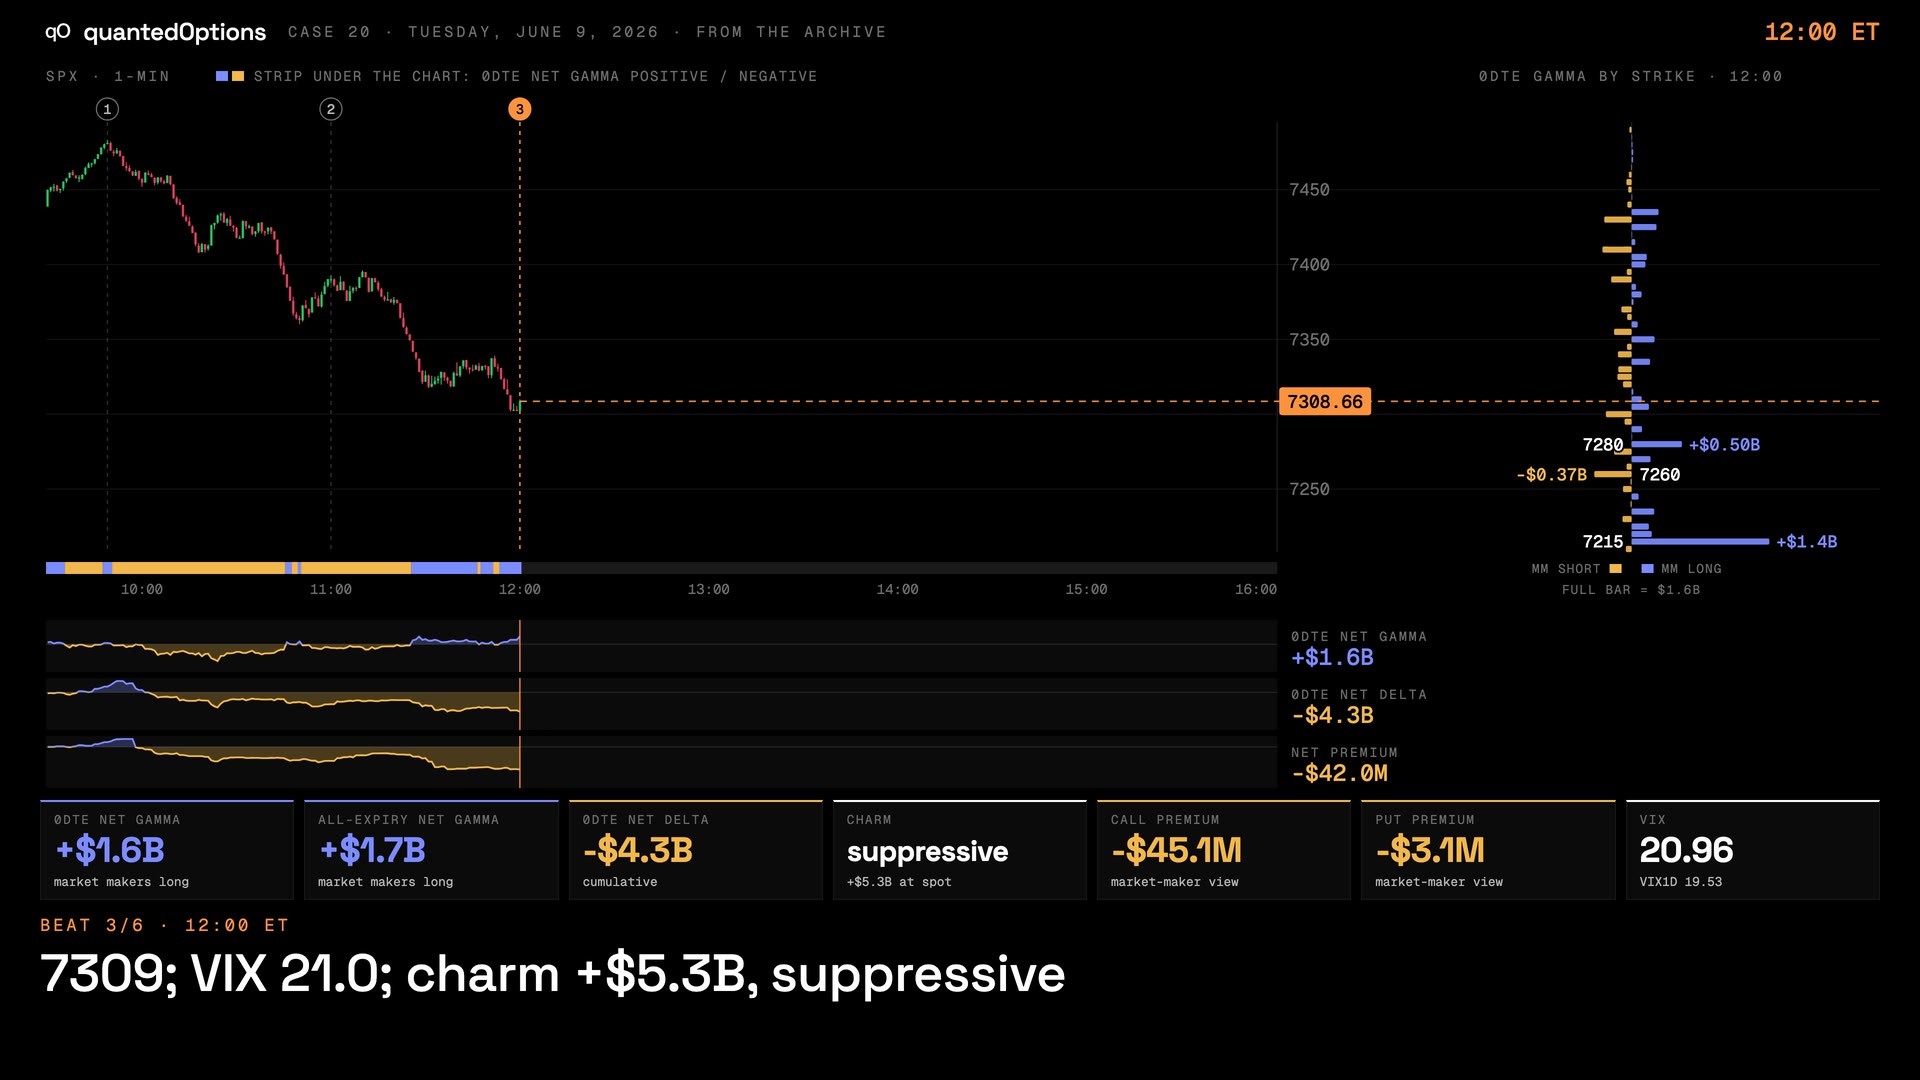
Case 20 · Jun 9, 2026
VIX ran to the expiring contract's largest strike and turned — and so did SPX
9 slides
The walk-through, slide by slide
Slide 1 / 9
From the product
Real frames
Shot off the live product, nothing redrawn. Click the right side of a frame for the next one, the left side to go back.
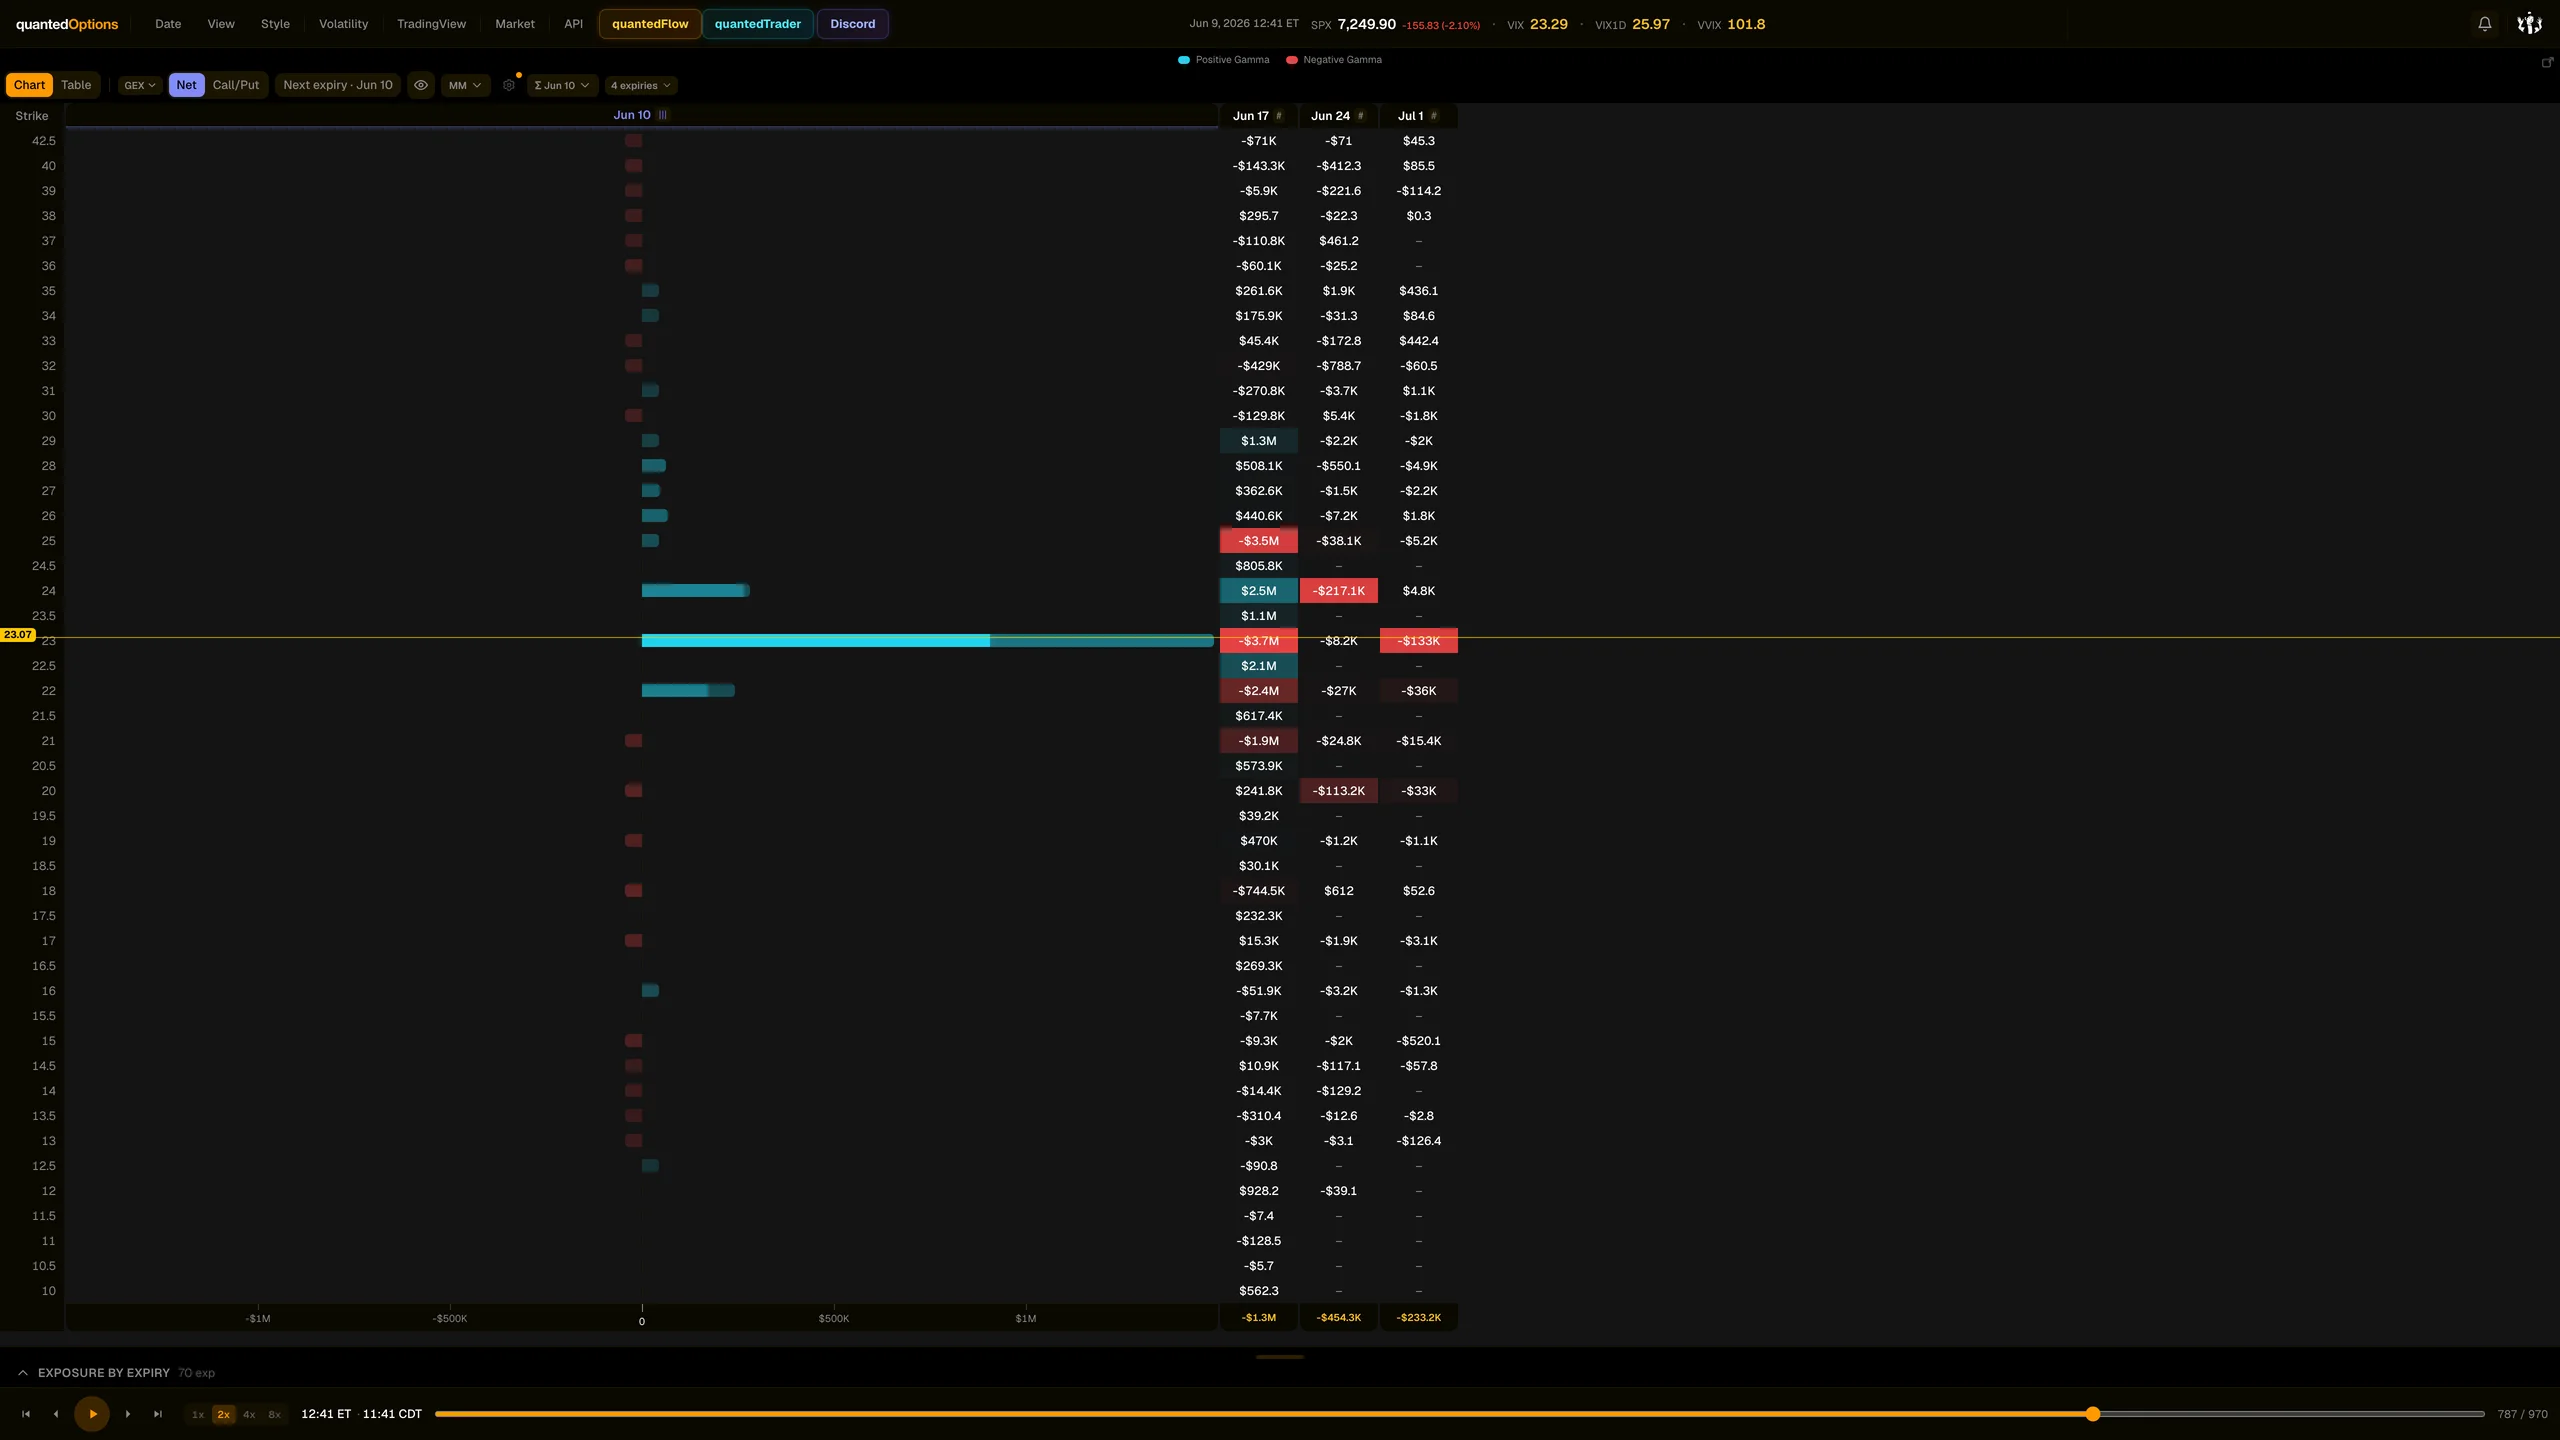
Product frame 1 / 2
These pages describe what the displays show and what the data did on the sessions shown. They are not trading advice, and a past session is not a forecast of a future one.