Gamma, levels & flowon 5,000+ tickers
Two dashboards in one plan — quantedTicker and quantedFlow. What's in it:
- Gamma, charm, vanna and delta exposure for your favorite ETFs and equities
- The price chart with the gamma behind it — call wall, put wall and the flip drawn on
- Net delta, premium flow and the contracts printing unusual volume
- Volatility panels — IV rank, surface summary, term structure, smile, strike matrix
- quantedFlow, the options-flow scanner across 5,000+ tickers
- Every minute, with replay of any minute of any day
* SPX gamma here is computed from open interest. Signed CBOE market-maker positioning for SPX & VIX — the licensed C1 participant data — is quantedGamma Classic and Ultra.
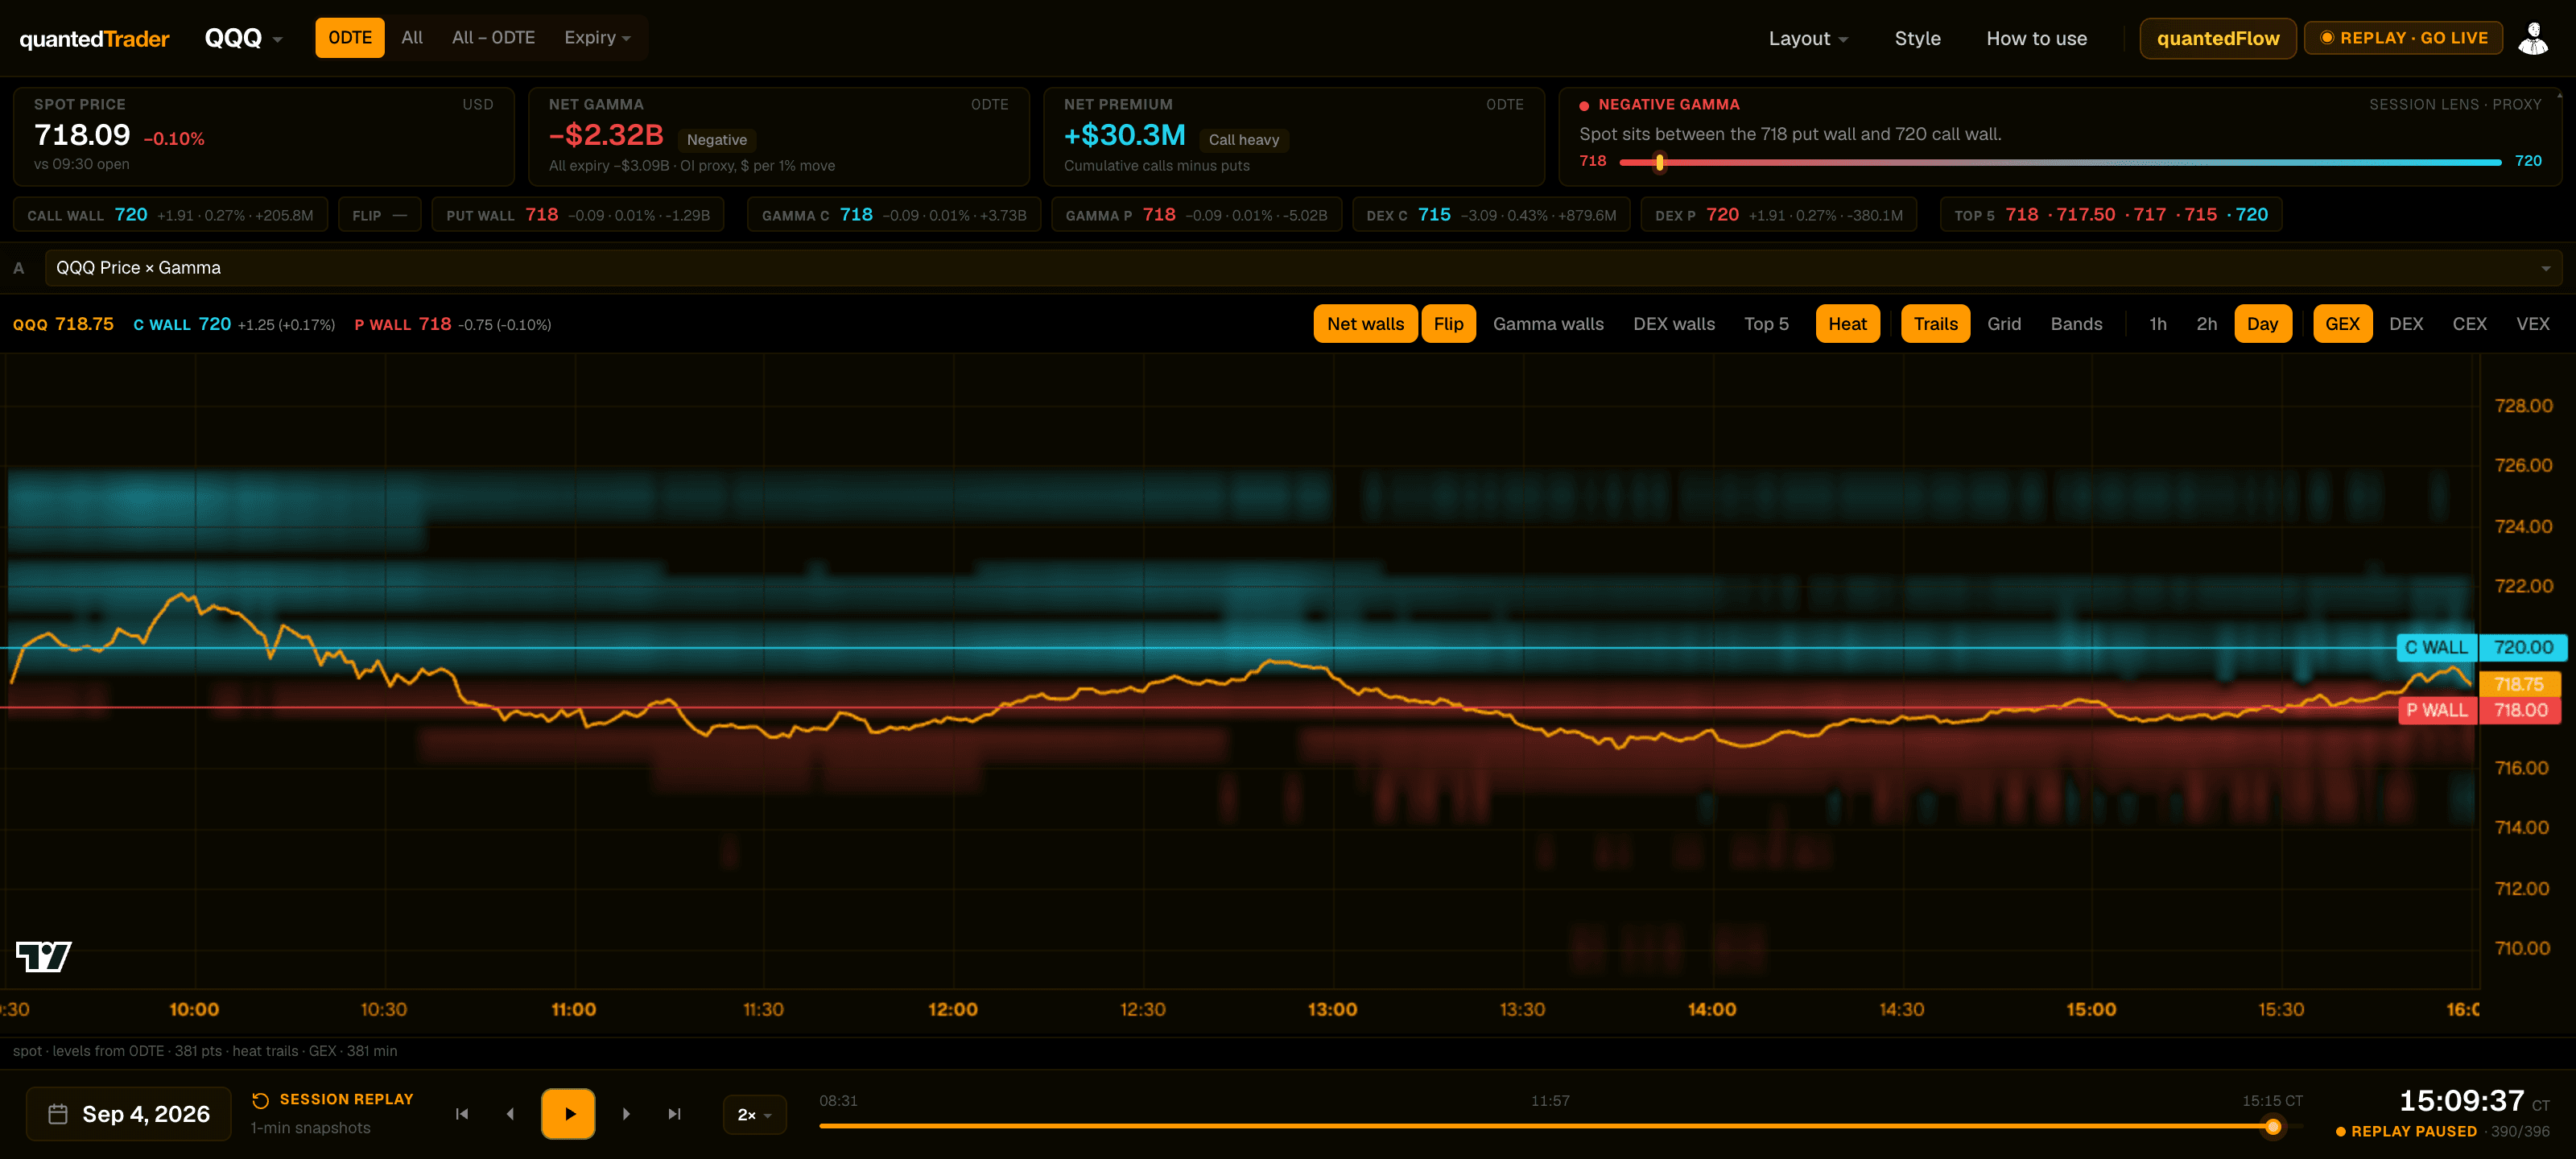
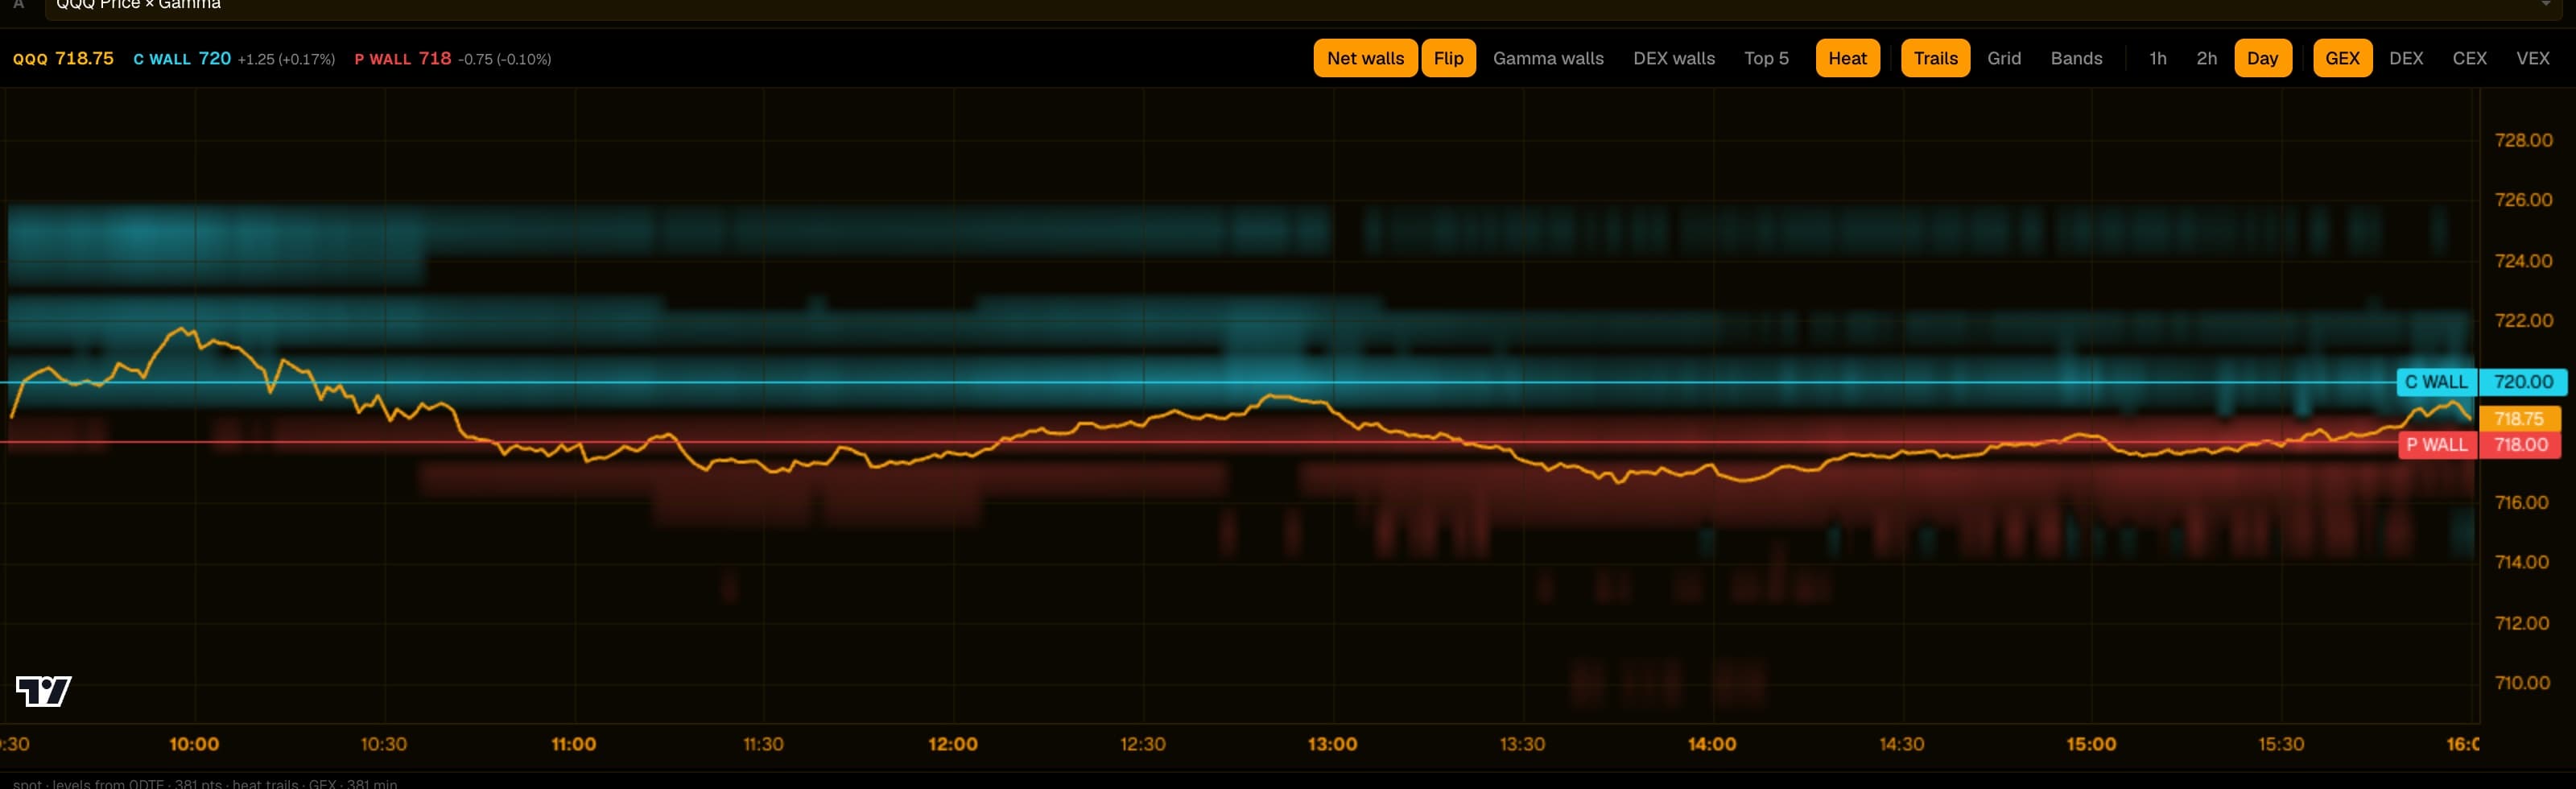
Price × Gamma — the day's price over the gamma behind it, with the call wall, put wall and flip drawn across. The session strip above.
What you get
What's on the screen.
Price × Gamma
The day's price chart with the gamma behind it. The strikes carrying the most gamma show as colour under the price line, and the call wall, put wall and gamma flip are drawn straight across it. One look shows which strikes matter today and where price sits against them.
Session strip & levels
The numbers that matter, always on screen: the price and its move since the open, whether net gamma is positive or negative, whether calls or puts are taking more premium, and a row of the key strikes — call wall, put wall, flip, top five — each with how far it is from the current price.
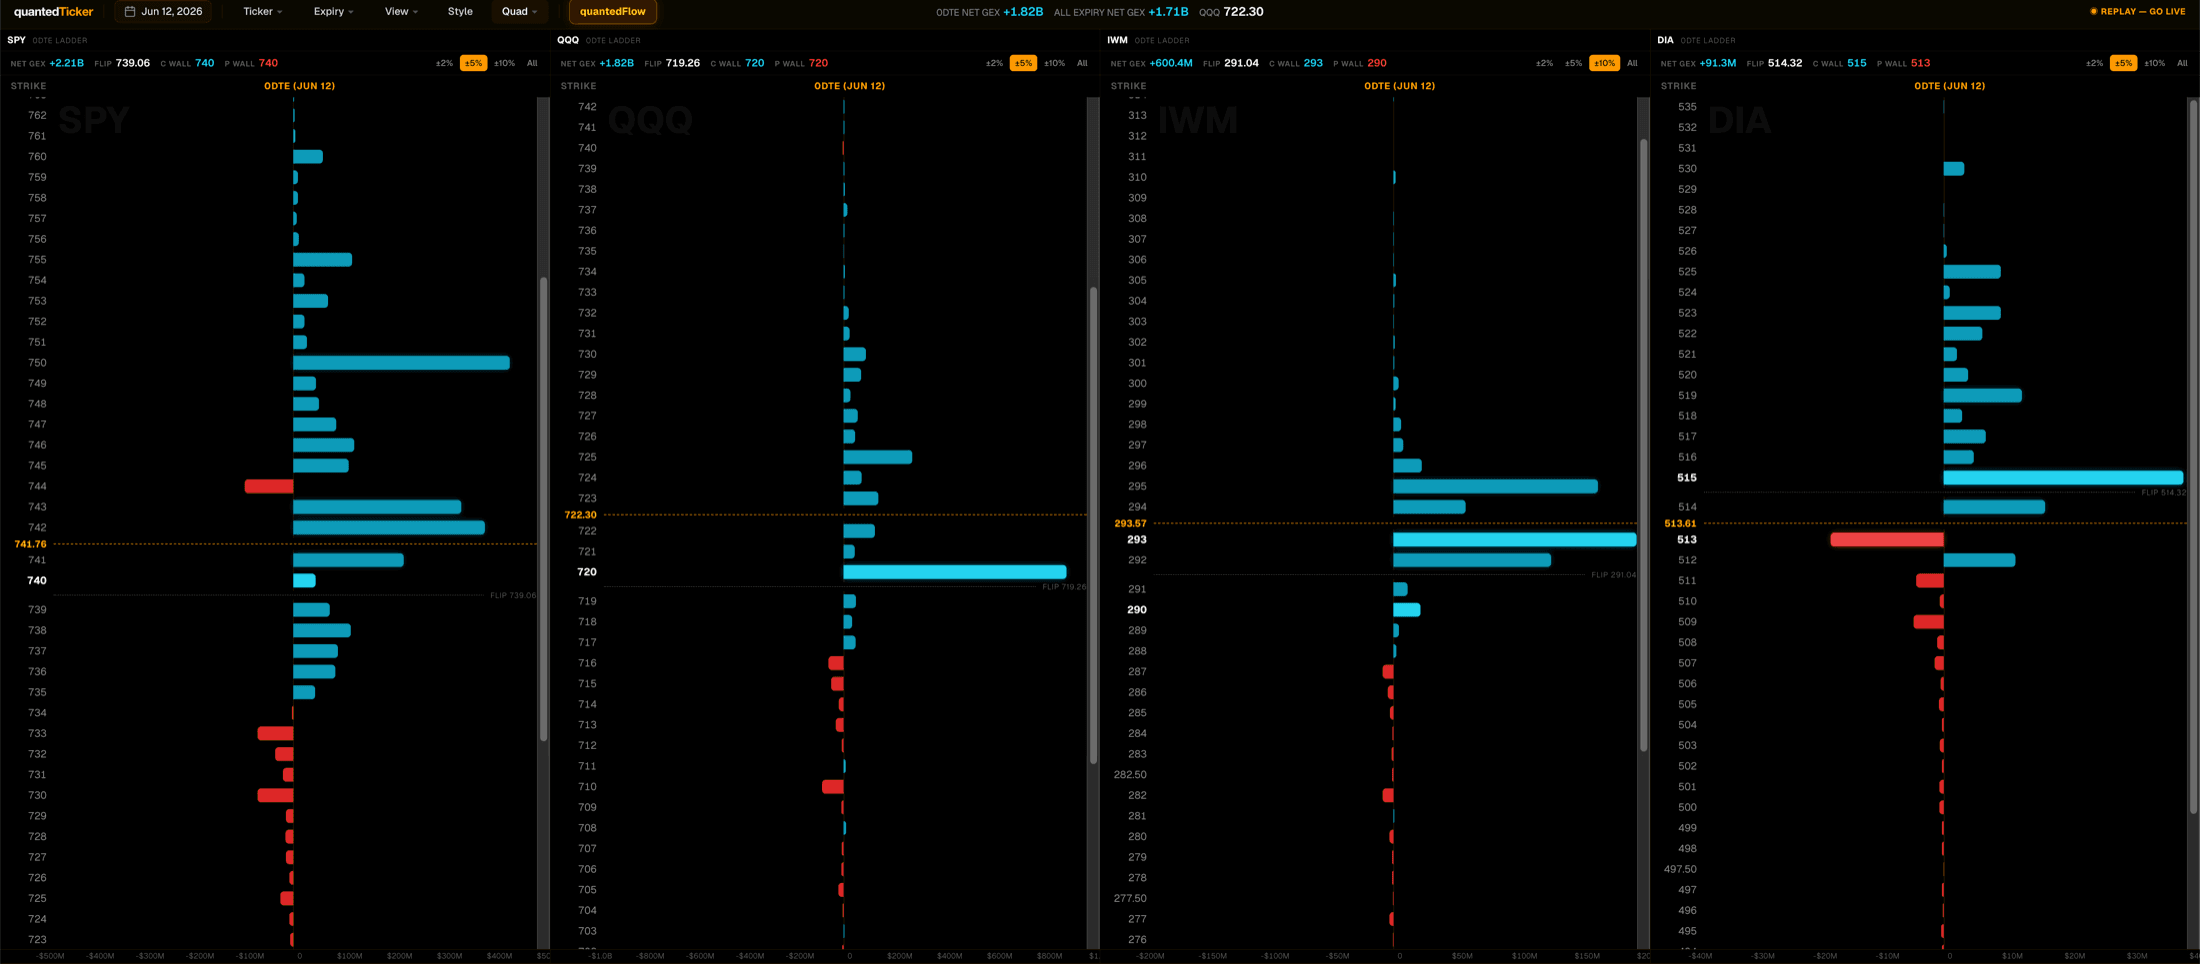
Strike Profile
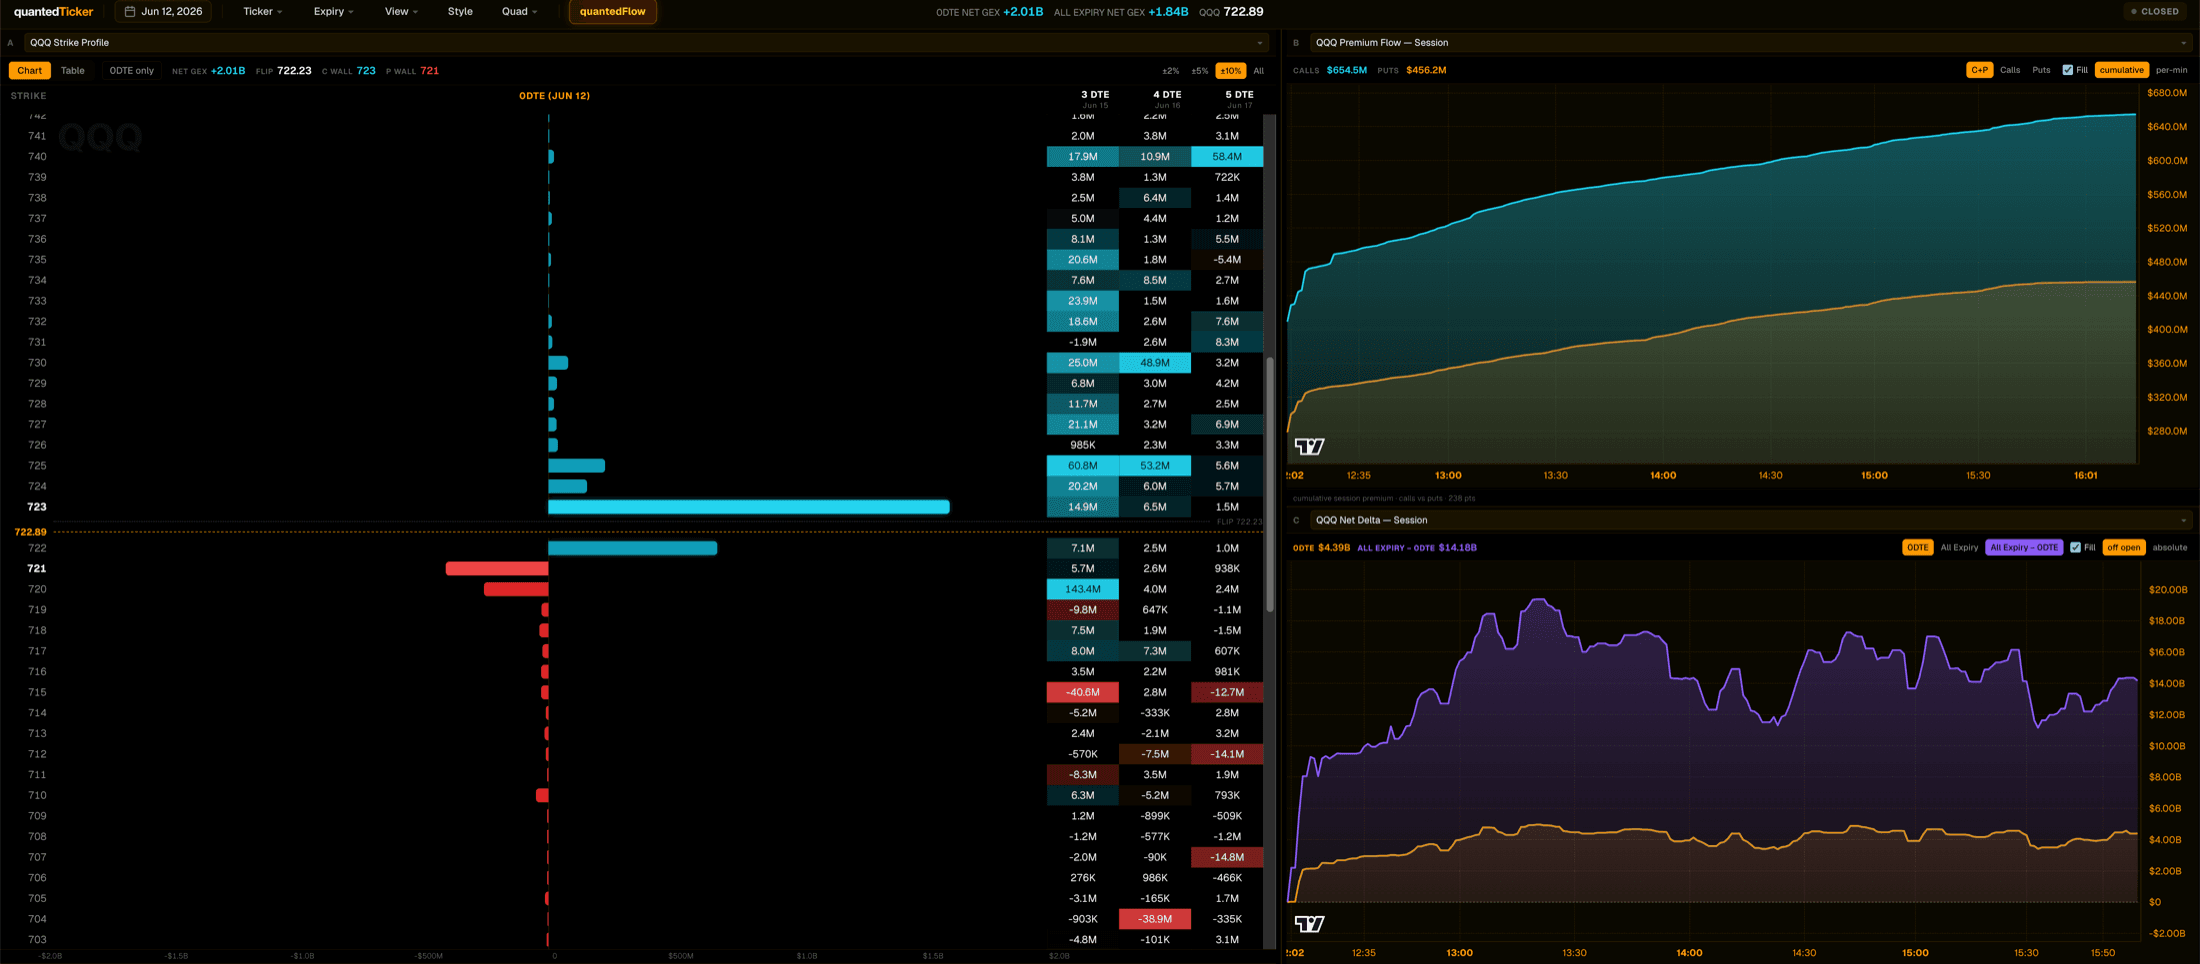
Gamma strike by strike, as a bar ladder around the current price. Switch to the table and every expiry becomes a column, with the biggest strike in each one lit up — where the gamma sits today, and where it sits further out.
Net delta & premium flow
Two session charts. Net delta shows how the option book's directional exposure shifts minute by minute, today's expiry against the rest. Premium flow shows where the money went — dollars traded in calls and puts at each strike, so the busiest strikes stand out.
Unusual volume
The contracts trading far more than their open interest — the flow that stands out today, for the ticker you're on. Ranked by premium; pick one and its 1-minute chart opens beside it.
Volatility mode
Flip the dashboard from positioning to implied volatility. IV rank and percentile with the expected 30-day move, a surface summary of level, skew and wings from 1 day to 3 months, the term structure across expiries, the smile, and a strike-by-expiry IV matrix that colours by level, by change, or by the change beyond what the move explains. It replays with the scrubber like everything else.
quantedFlow, included
The options-flow scanner, in its own dashboard: unusual options activity as it prints across 5,000+ names, ranked by premium, volume against open interest and delta-weighted flow — the same scanner Classic and Ultra carry.
Replay, favorites & layouts
Every minute of every session is kept. Drag the scrubber back and everything on screen redraws as of that minute, so you can watch how a day unfolded. Star your tickers, search with ⌘K, arrange the panes the way you like — and a How to use guide describes every display.
One screen, the whole session
Price, gamma, net delta and premium flow — all as of the same minute.
The default layout. Six ways to arrange the panes; click any pane title to swap what it shows.
Volatility mode
Implied volatility, the same way: rank, surface, term structure, smile.
One switch beside the ticker swaps the positioning grid for five panels of implied volatility. IV Rank shows where today's 30-day IV sits in its history and what move that implies; Surface Summary reads level, skew and wings from 1 day to 3 months against what is normal for the move; Term Structure lines up the at-the-money IV of every expiry against its usual band; the Smile draws one expiry across delta; and the Strike Matrix shows every strike and expiry, coloured by level, by change since the open, the last 15 minutes or the previous close, or by the change beyond what the move explains.
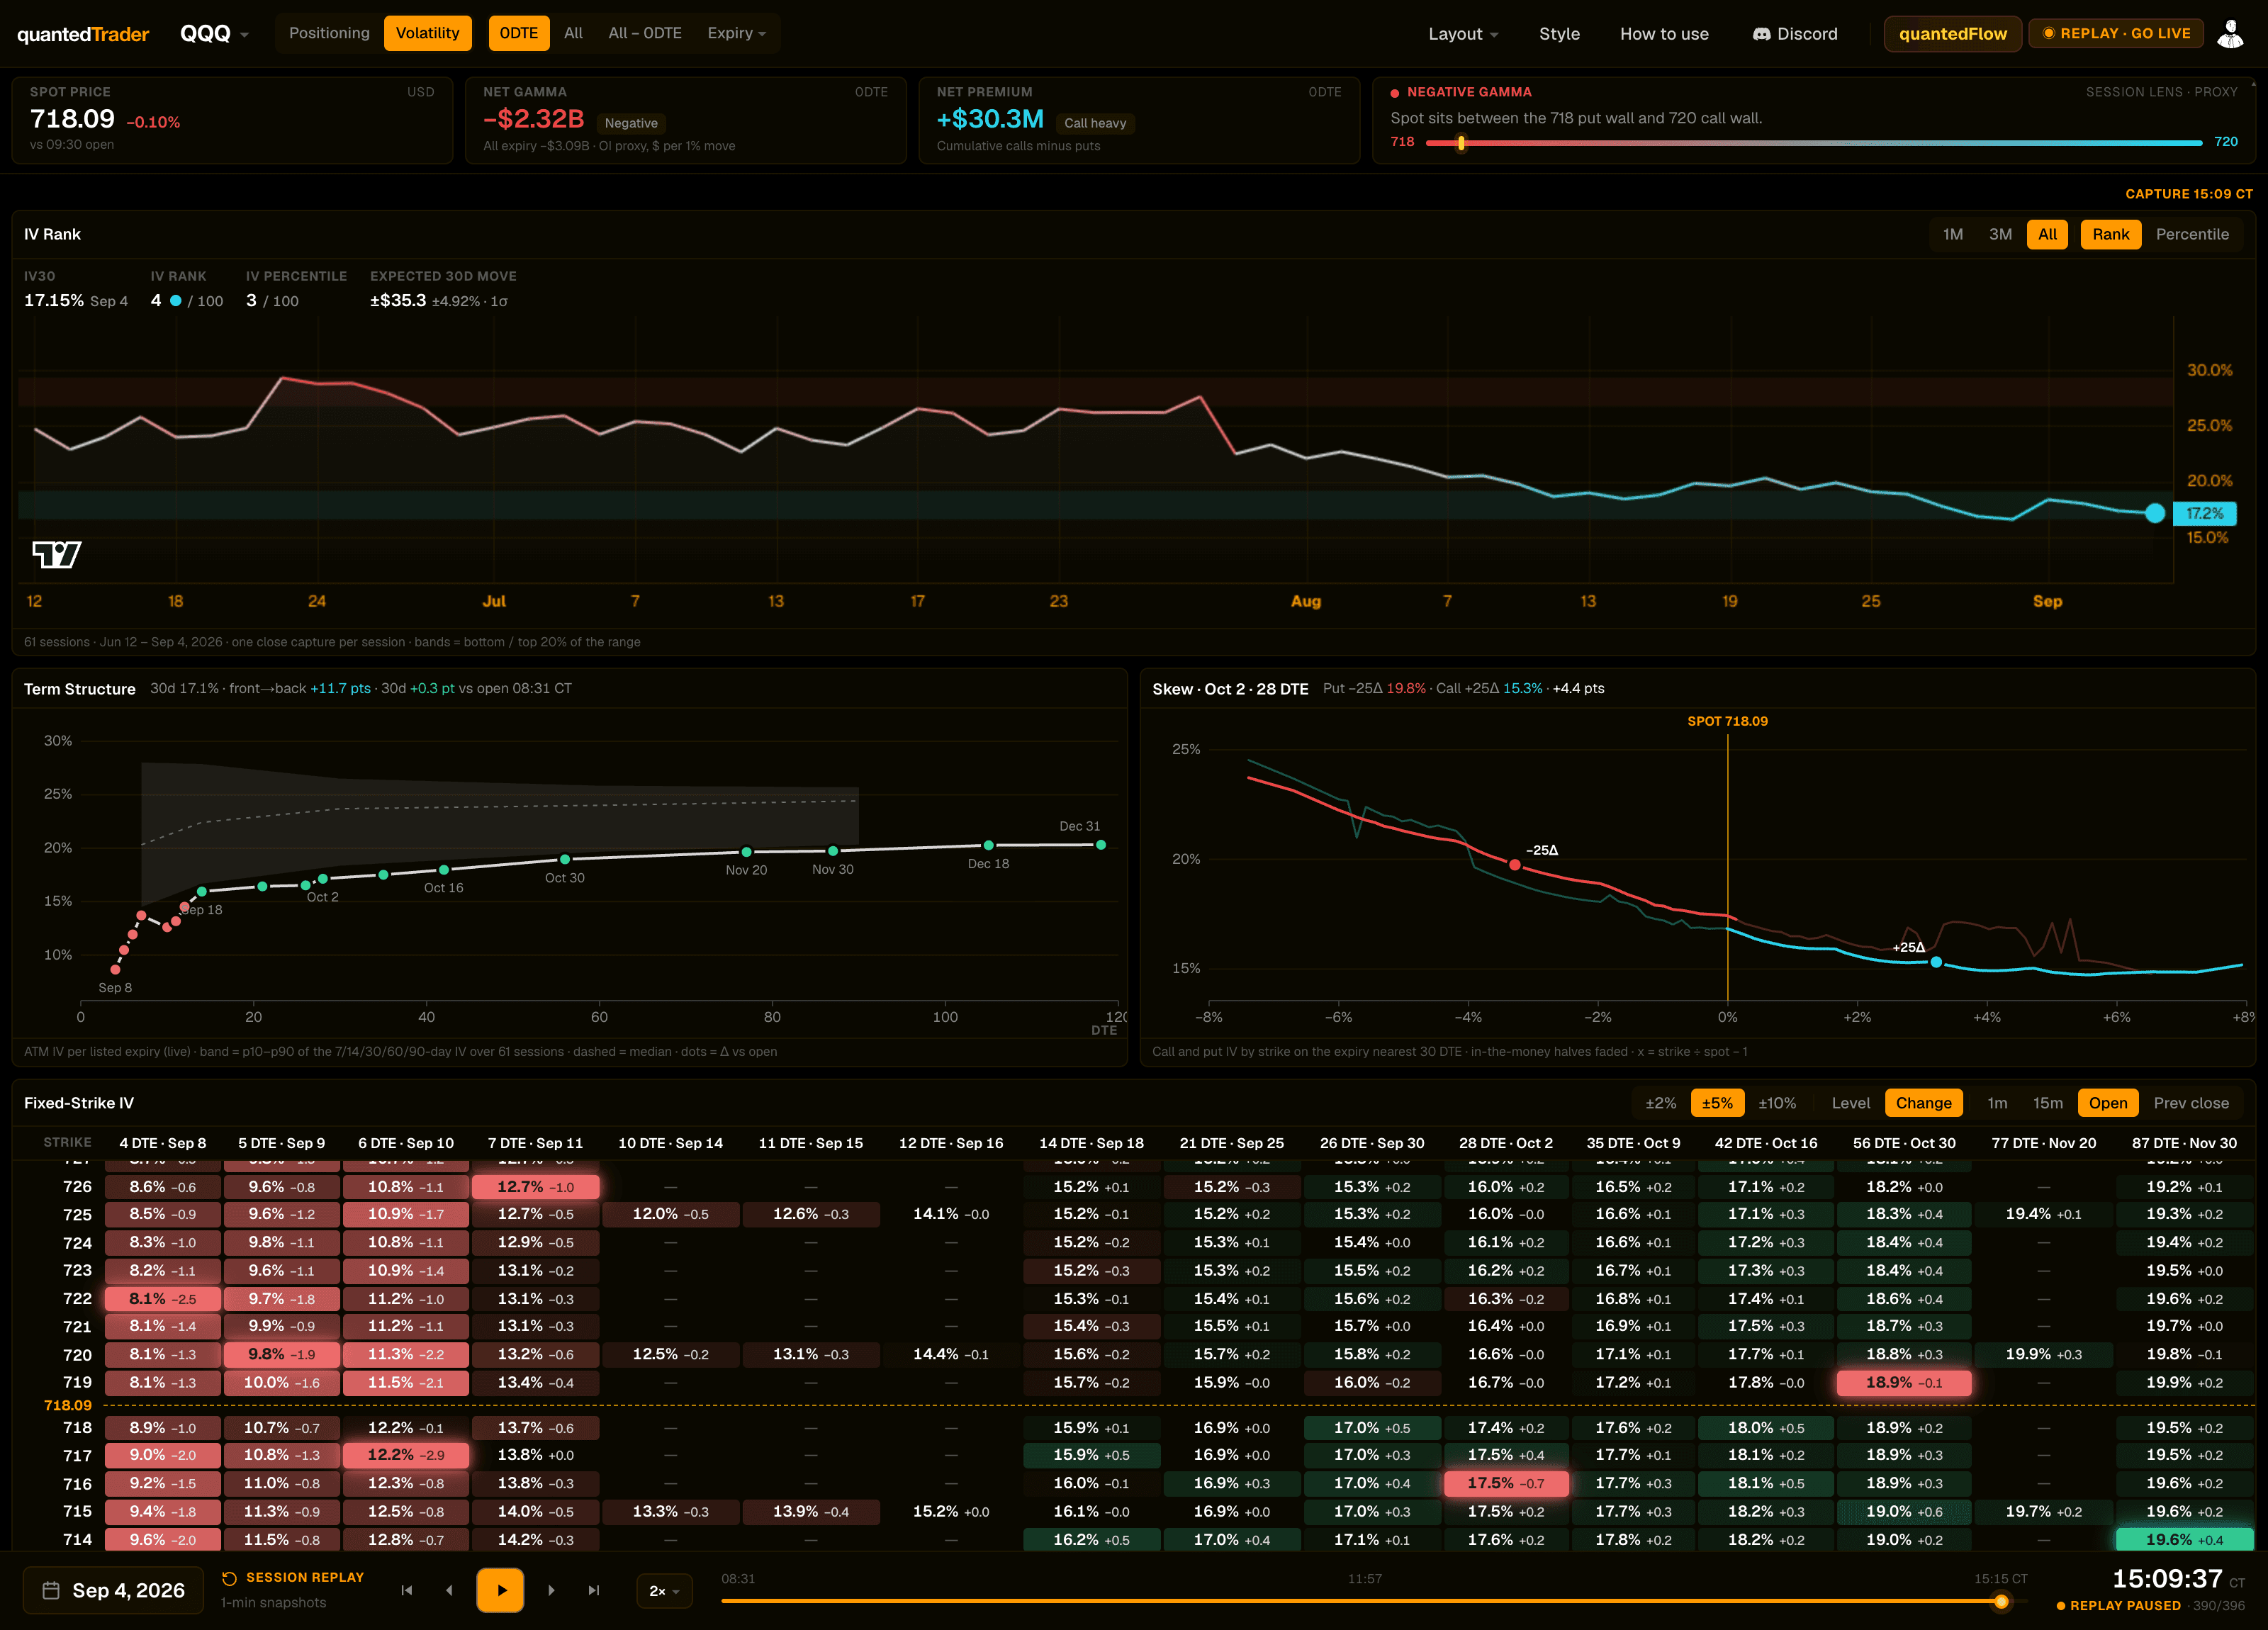
IV history is built nightly for each ticker as its chains are captured, so the index ETFs carry the longest history today.
Unusual volume
The contracts trading unusual size — and the chart behind each one.
Contracts trading at least their open interest today, ranked by premium — this replays with the scrubber too.
The data
Consolidated across every US options exchange.
quantedTrader is built on data consolidated from every US options exchange. Gamma, net delta and premium flow are computed from that cross-exchange tape, not a single venue, so what you see reflects the whole market.
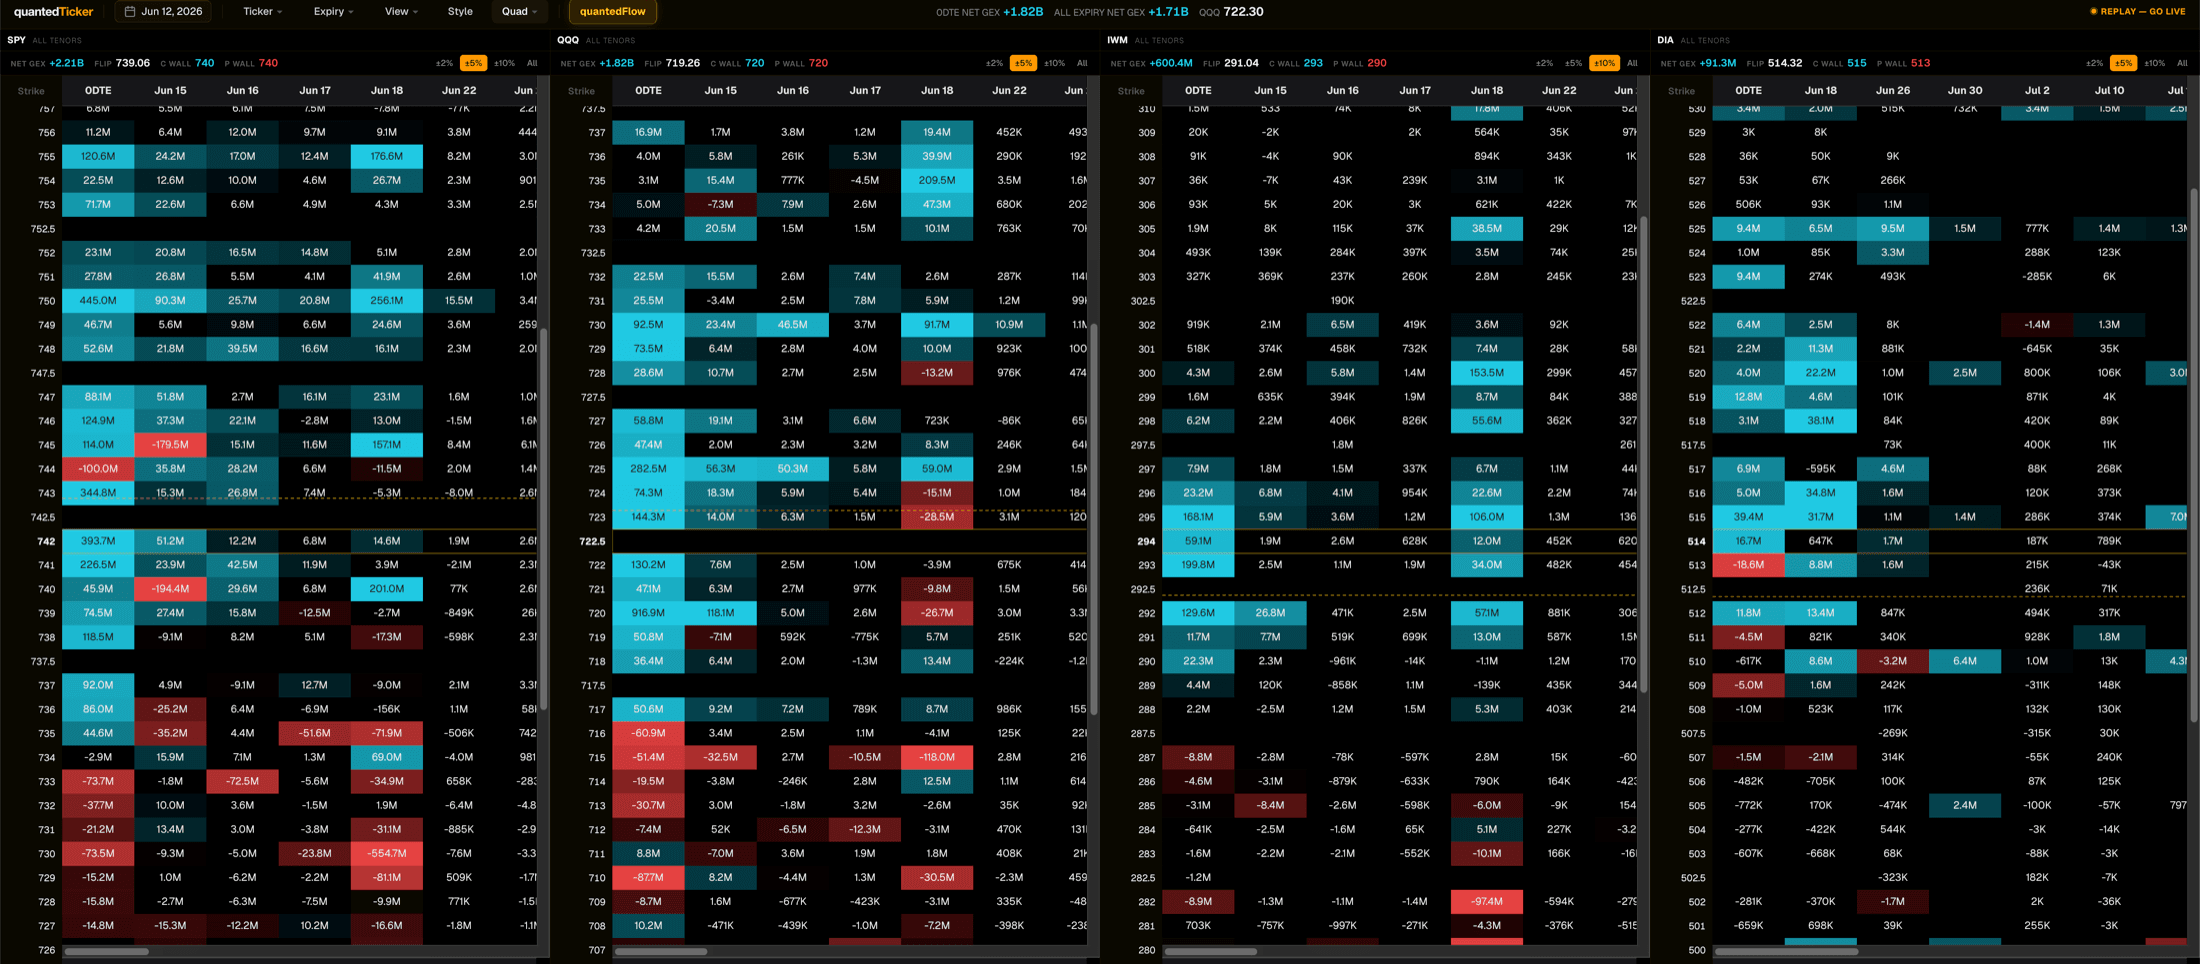
And it's recomputed every minute through the trading day — a fresh snapshot per ticker each minute, kept, so any minute of any day can be replayed. The table below is the Strike Profile with every expiry as a column, the biggest strike in each one lit.
SPX is included as open-interest gamma, from the same consolidated tape as every other ticker. quantedTrader does not carry the licensed CBOE SPX/VIX quantedGamma dashboard — signed market-maker positioning, measured rather than inferred from open interest — nor API access or the Orderflow Plugin; those live in quantedGamma Classic, Ultra and the plugin.
$39/mo. 5,000+ tickers.
Gamma heat on price, the walls and the flip, net delta, premium flow, unusual volume, a volatility mode and the quantedFlow scanner — across 5,000+ tickers, every minute.
Need licensed SPX CBOE gamma or API? See quantedGamma Classic & Ultra →