SPX Surface - Vanna
A heat map of how market-maker delta changes when implied volatility moves.
What it shows
The same grid coloured by vanna exposure: the dollar change in the market maker's delta for a 1% change in implied volatility, at each price and time.
What it is built from
Market-maker vanna from the same book as the gamma surface: the dollar change in the market maker's delta for a 1% change in implied volatility, at each price and time.
Reading
How to read it
- A positive cell means the market maker's delta rises there if implied volatility rises, and falls if it falls.
- A negative cell means the opposite.
- It matters most when implied volatility is moving; read it with the VIX readouts.
Controls
What each control does
| Control | Options | What it changes |
|---|---|---|
| Same toolbar as the gamma surface | Metric, 0DTE | All, candle interval, Opacity, Range | See SPX Surface - Gamma. |
Read it with
- Header readouts — VIX, VIX1D and VVIX tell you whether volatility is moving
Good to know
- Check VIX, VIX1D and VVIX in the header first: they tell you whether volatility is moving.
- Colour is scaled within each minute; read dollar values from the hover.
A real session
See it happen
15:46 ET
2026-08-04, a day when SPX and volatility rose together: at 15:46 SPX is at 7,757.88, up 2.07%, with VIX1D at 14.51. With volatility moving, the vanna surface is the one to read.
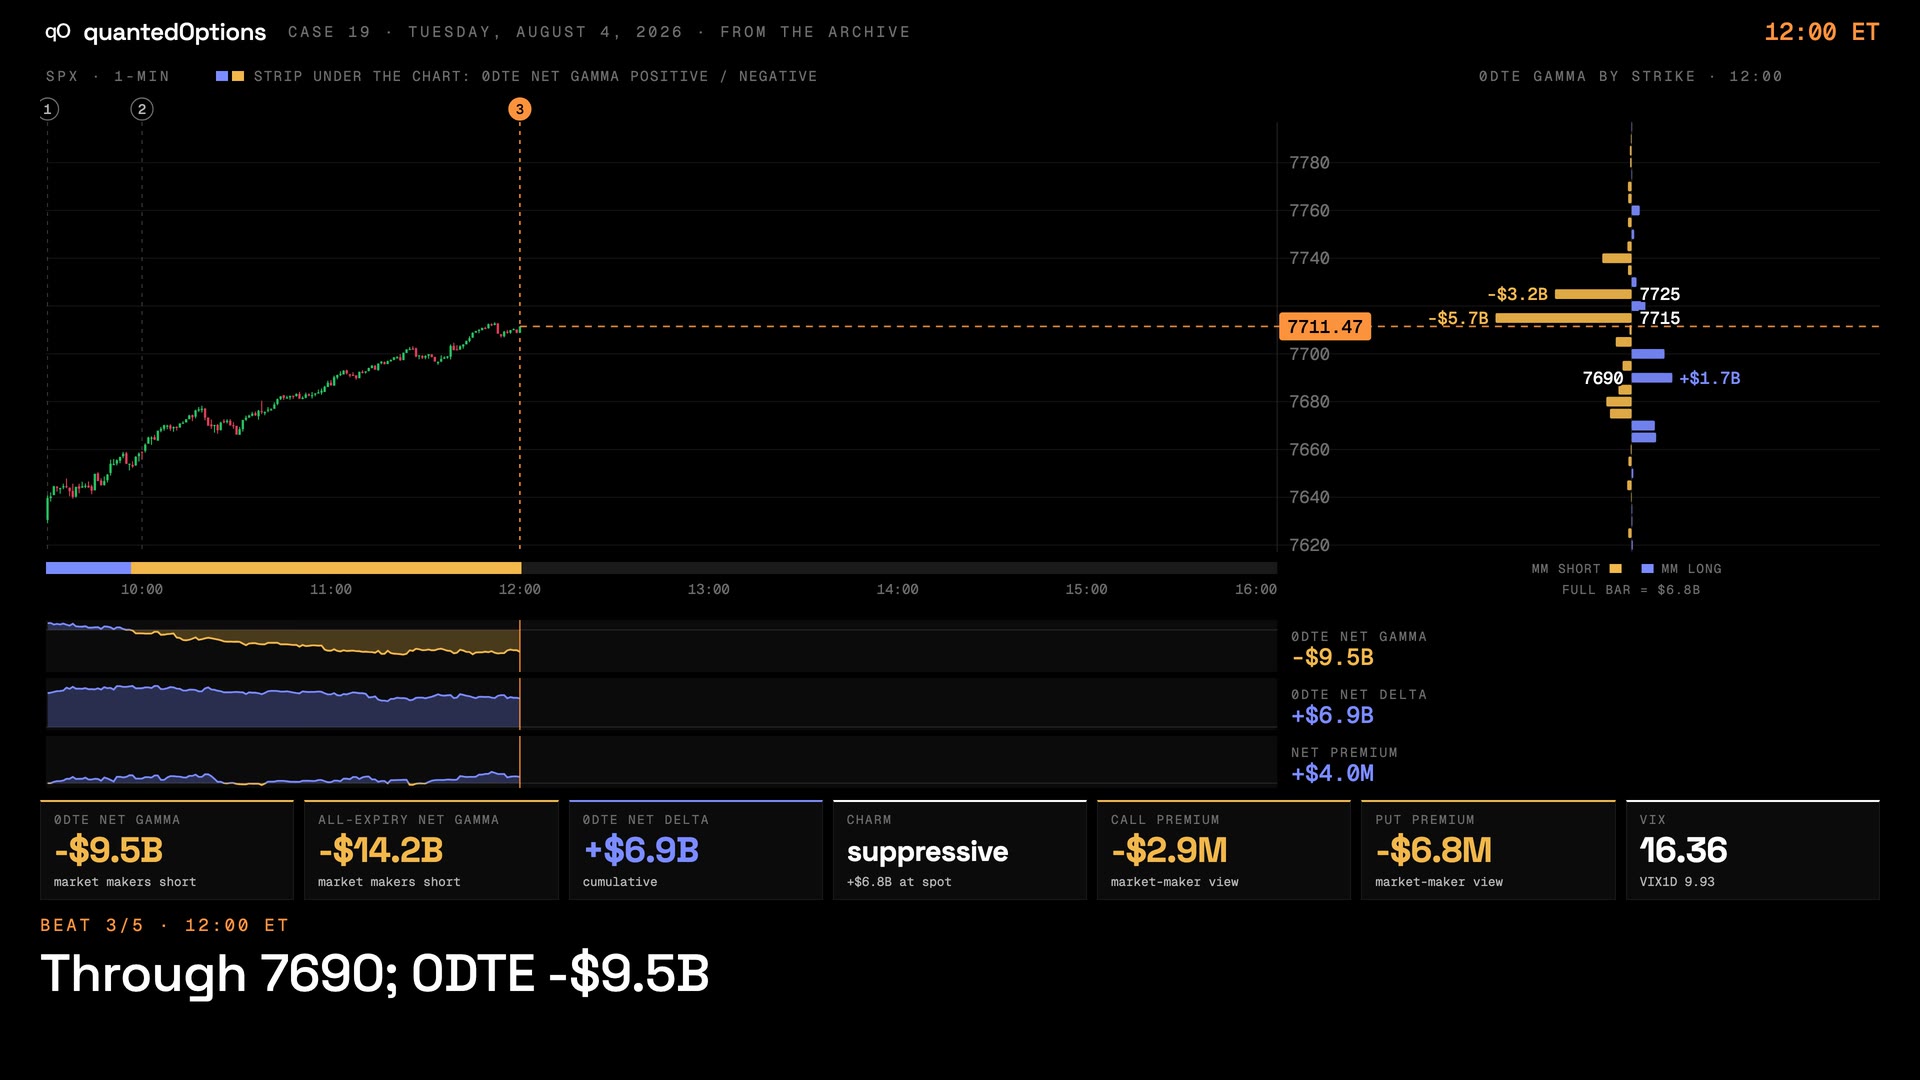
Case 19 · Aug 4, 2026
A rally in negative gamma: spot up, vol up
9 slides
The walk-through, slide by slide
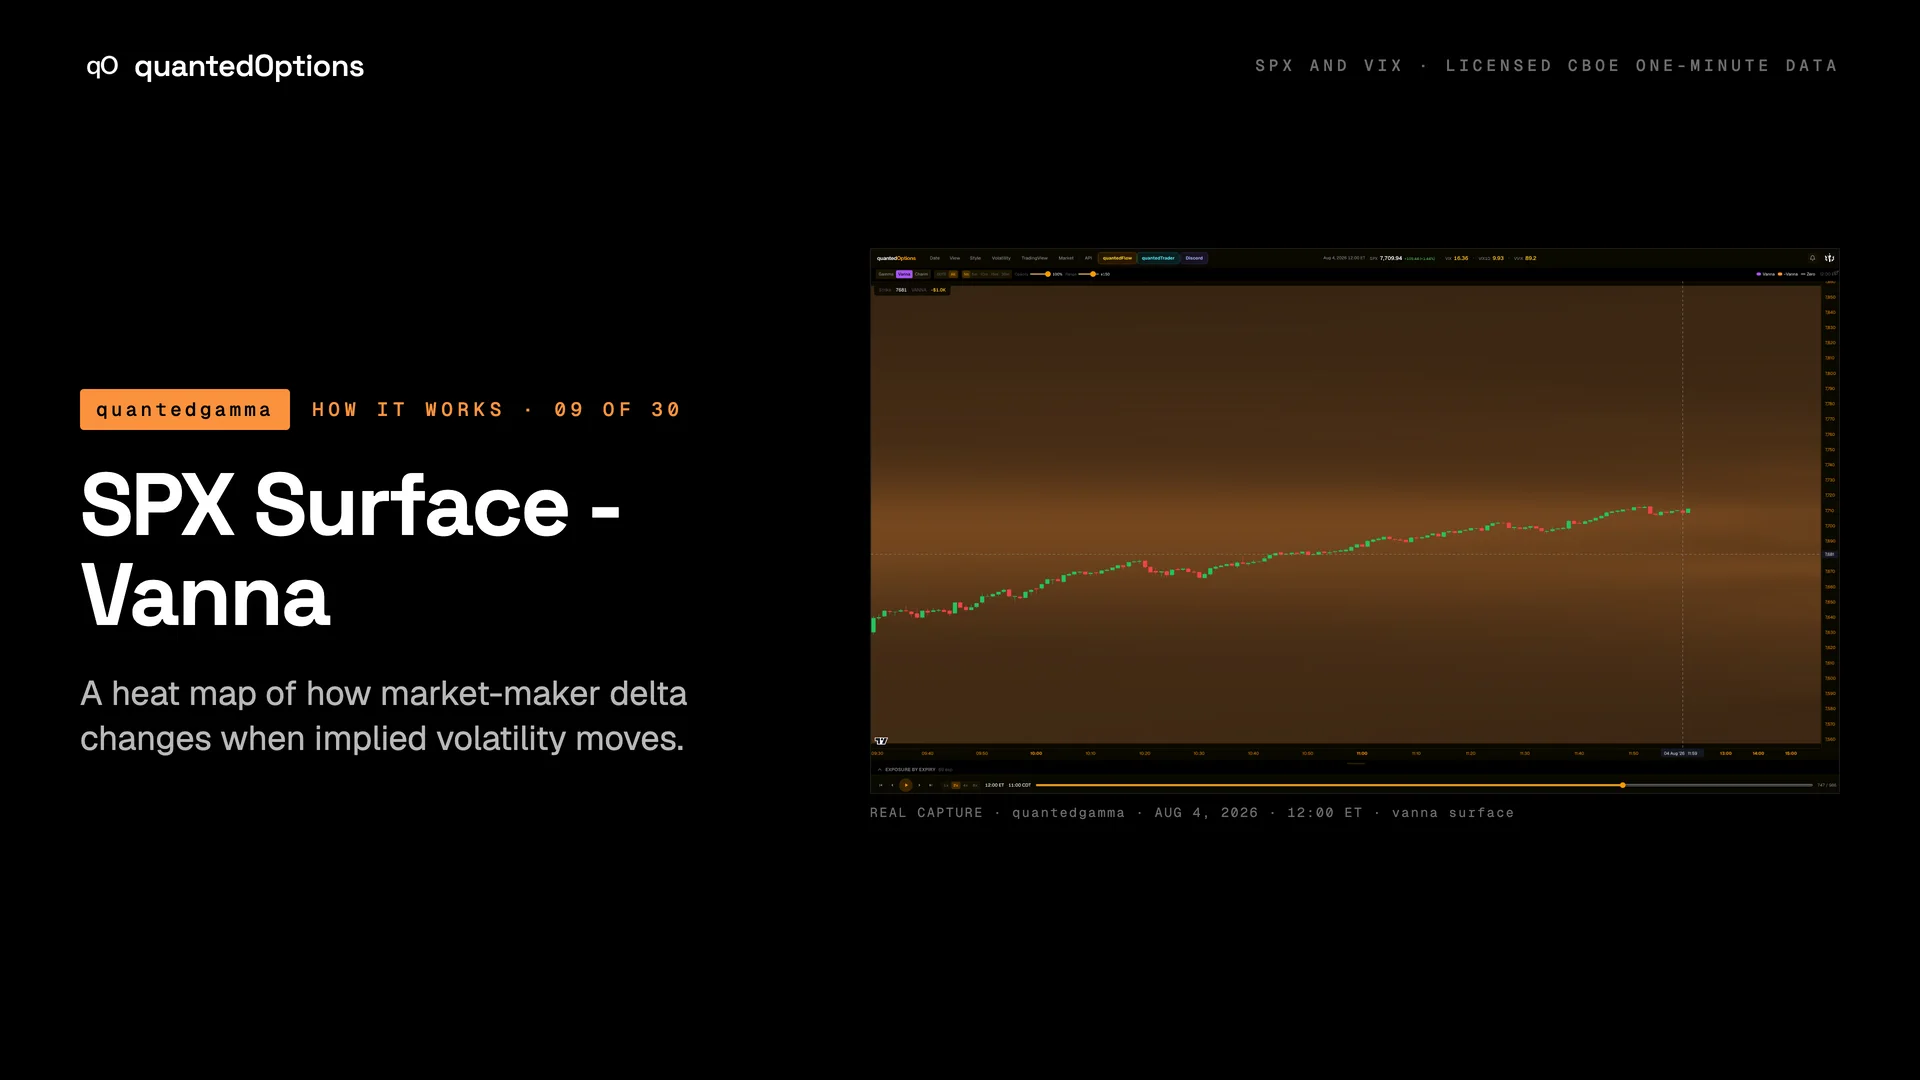
Slide 1 / 9
From the product
Real frames
Shot off the live product, nothing redrawn. Click the right side of a frame for the next one, the left side to go back.
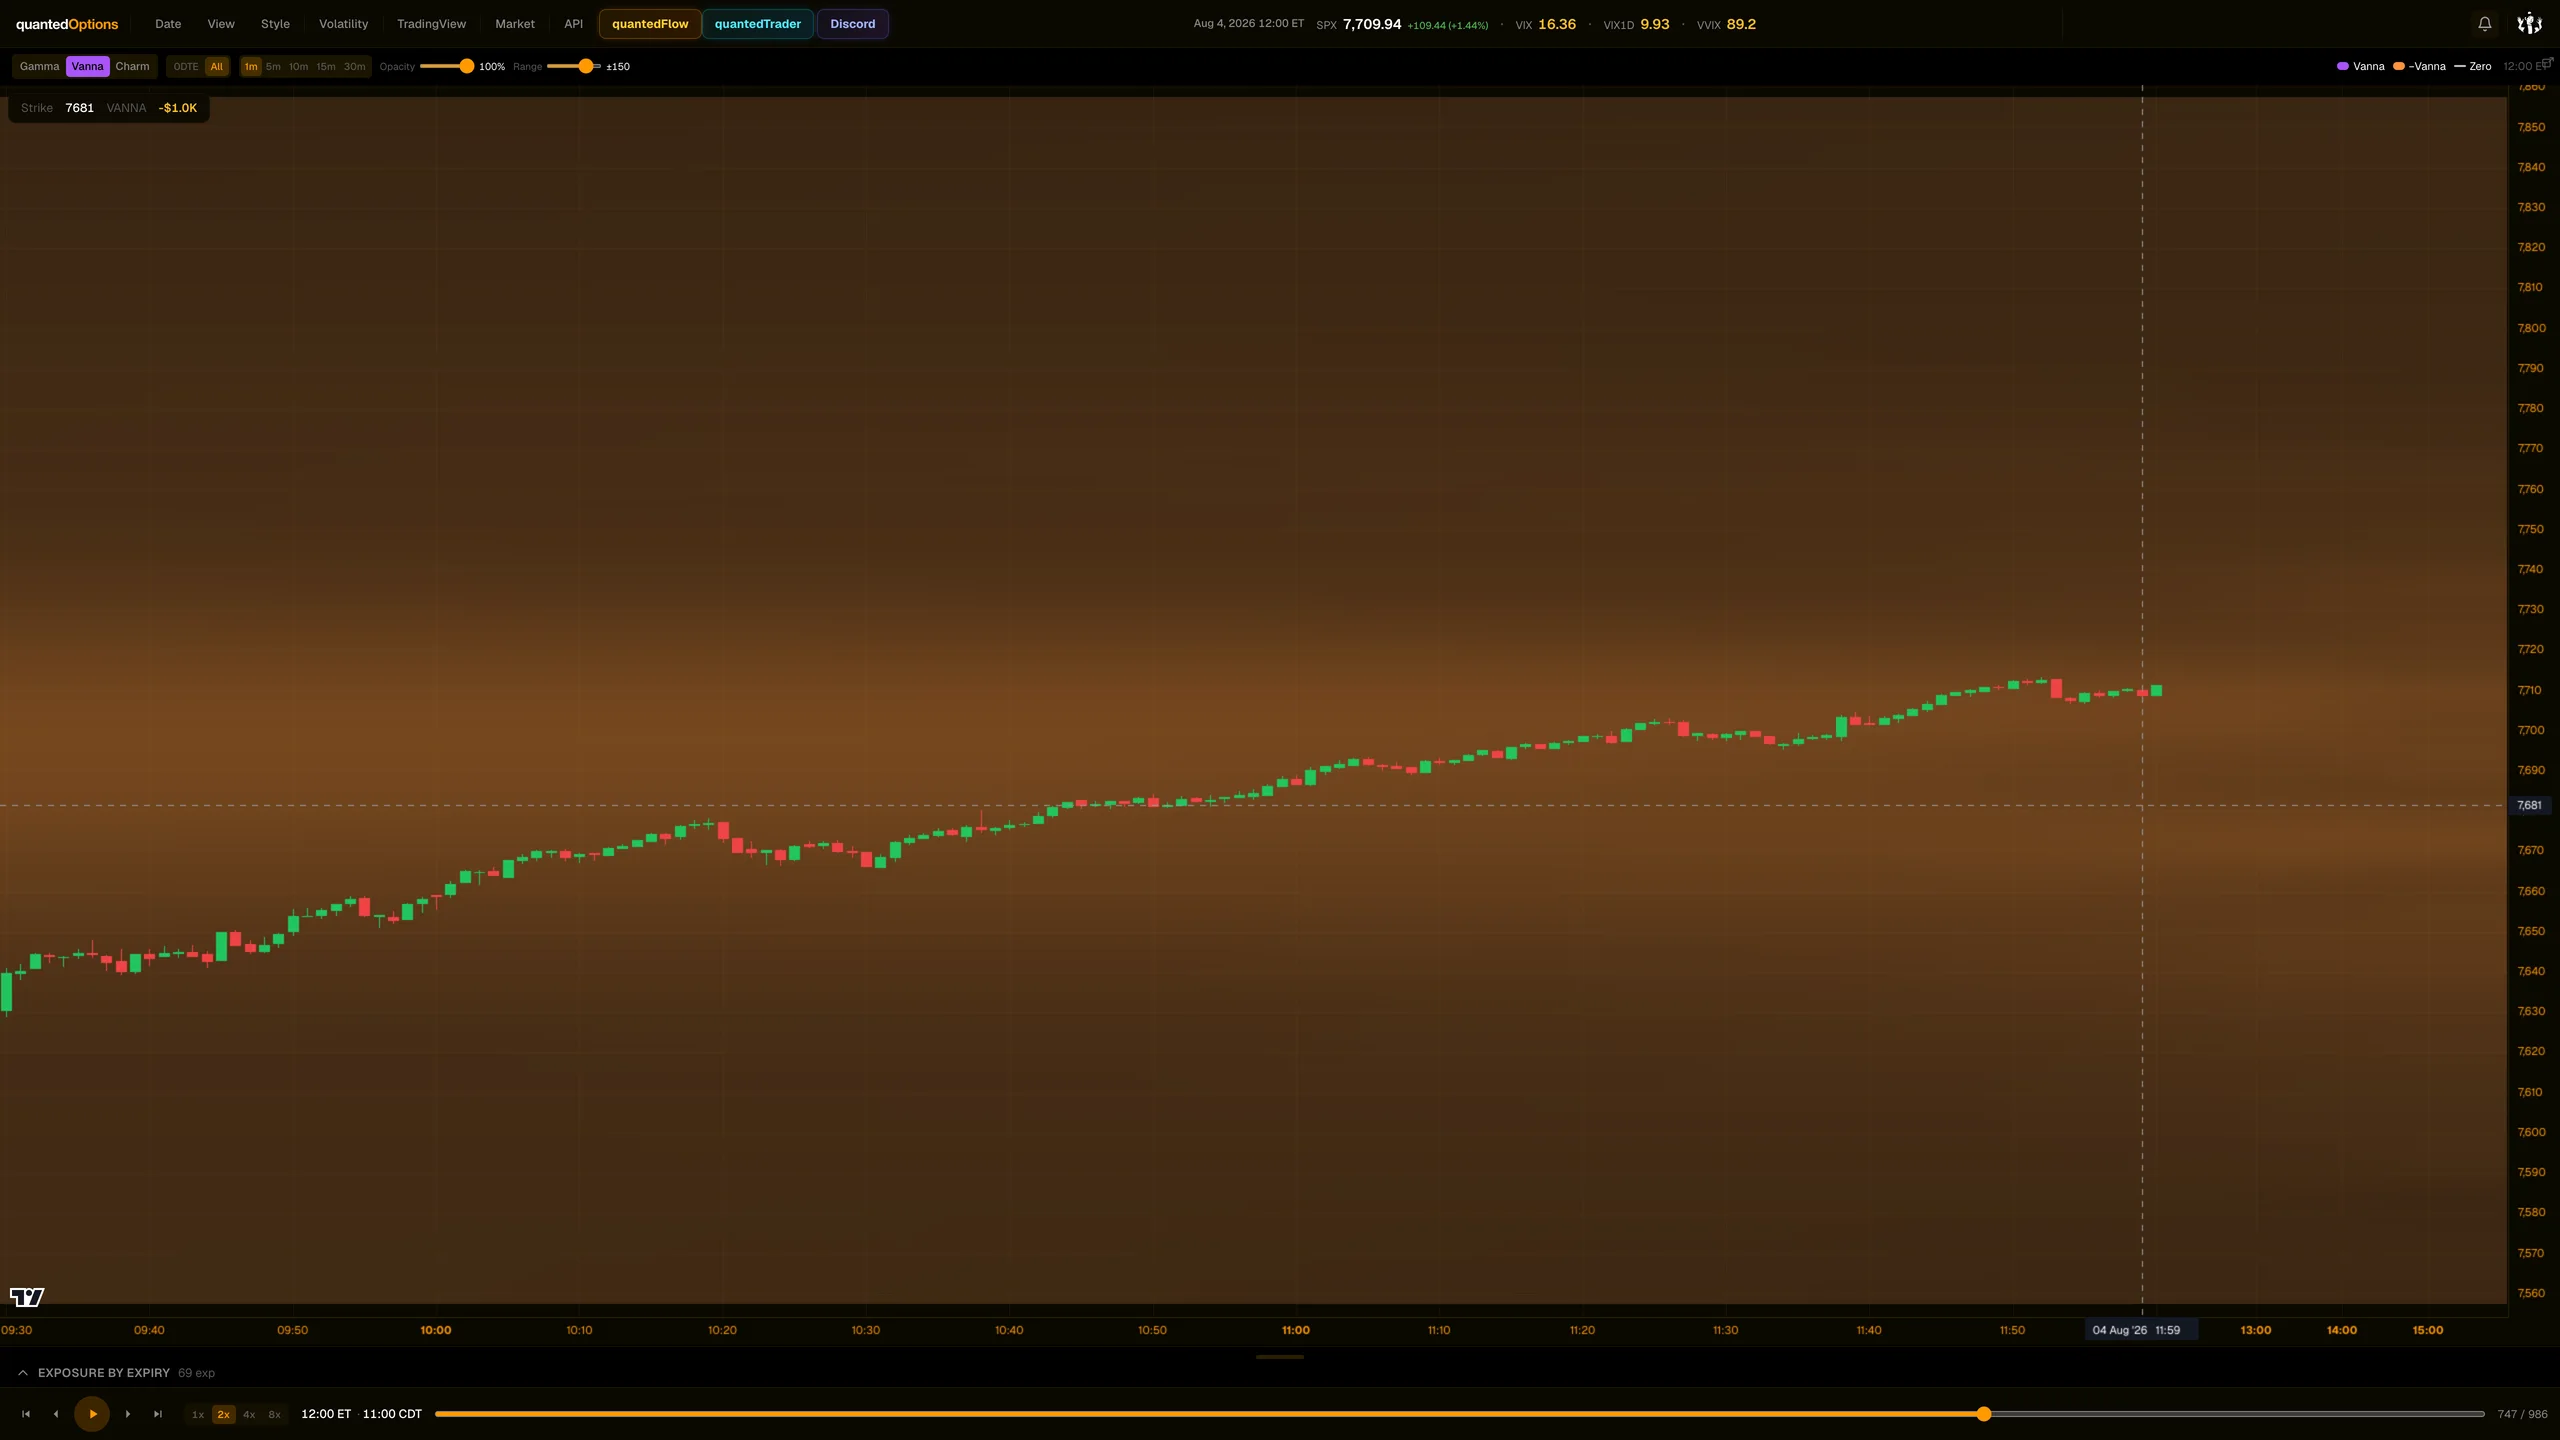
Product frame 1 / 2
These pages describe what the displays show and what the data did on the sessions shown. They are not trading advice, and a past session is not a forecast of a future one.