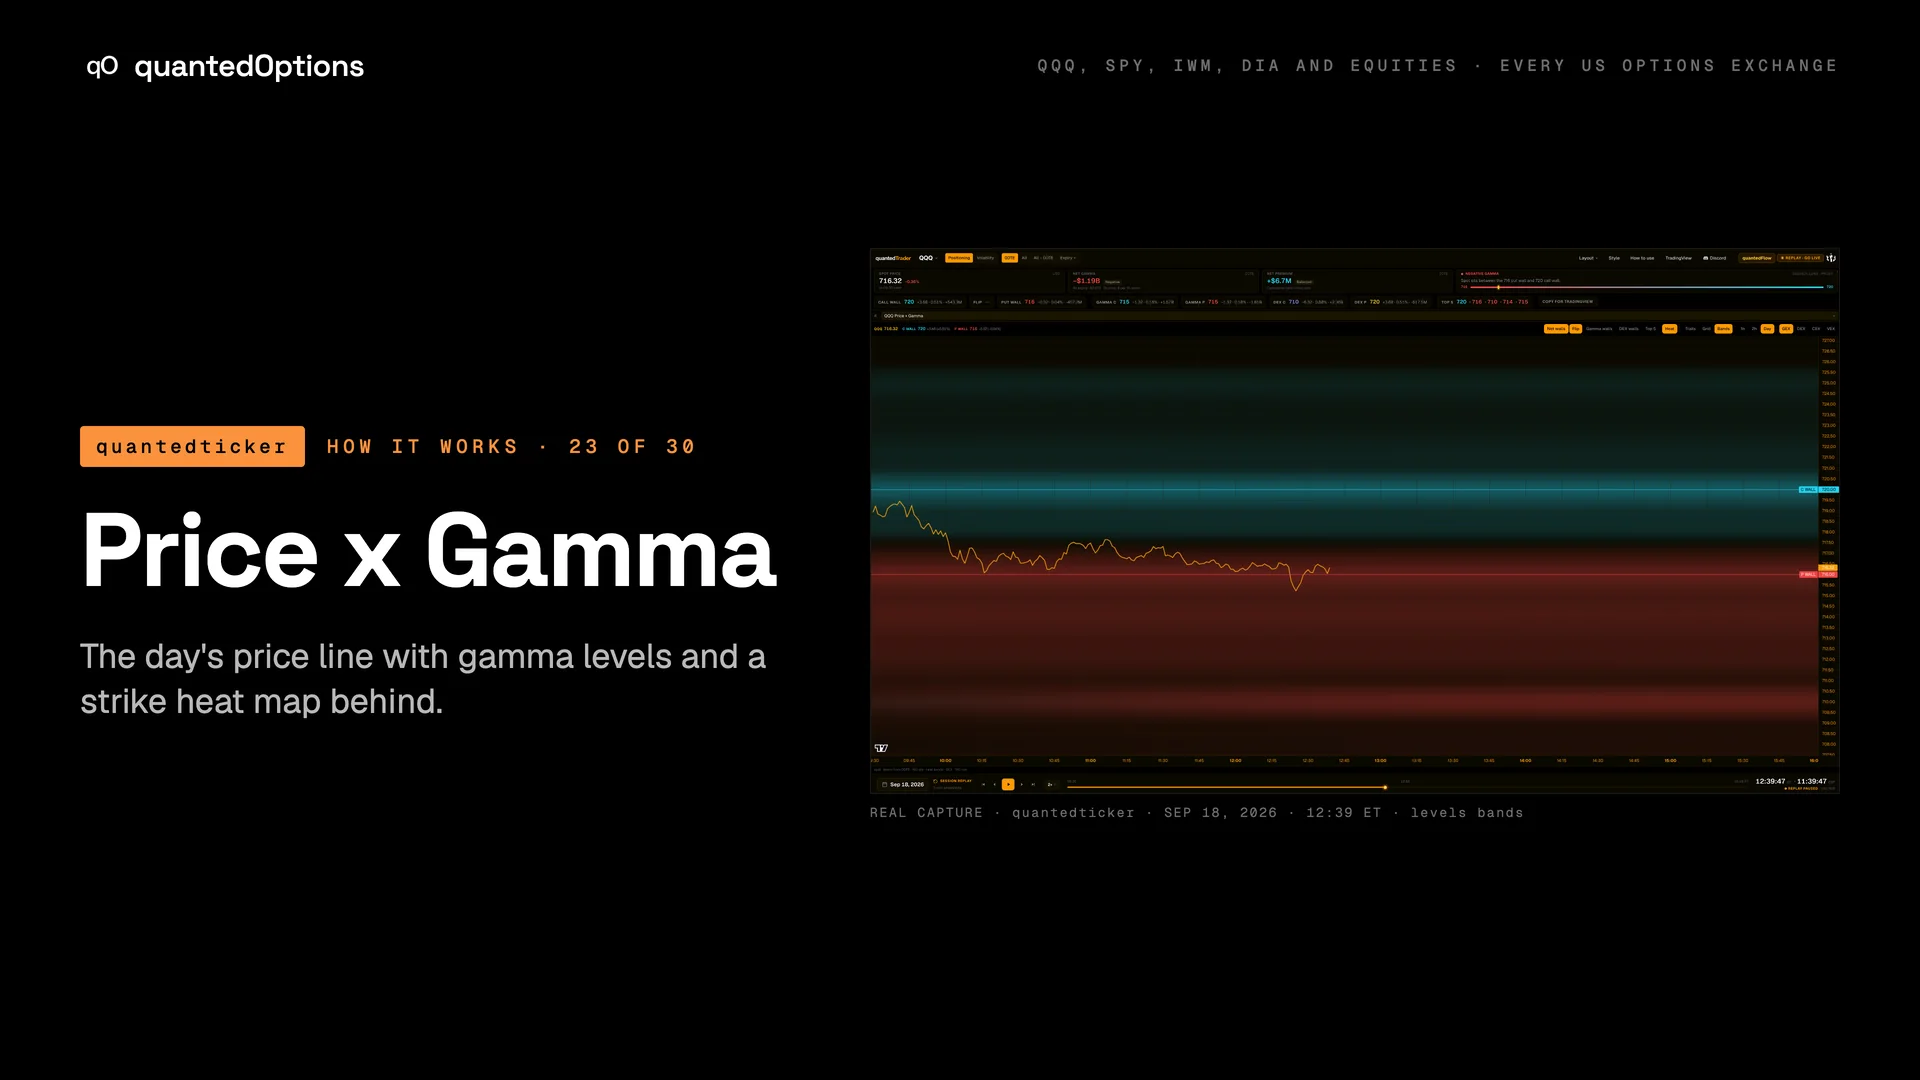
Price x Gamma
The day's price line with gamma levels and a strike heat map behind.
What it shows
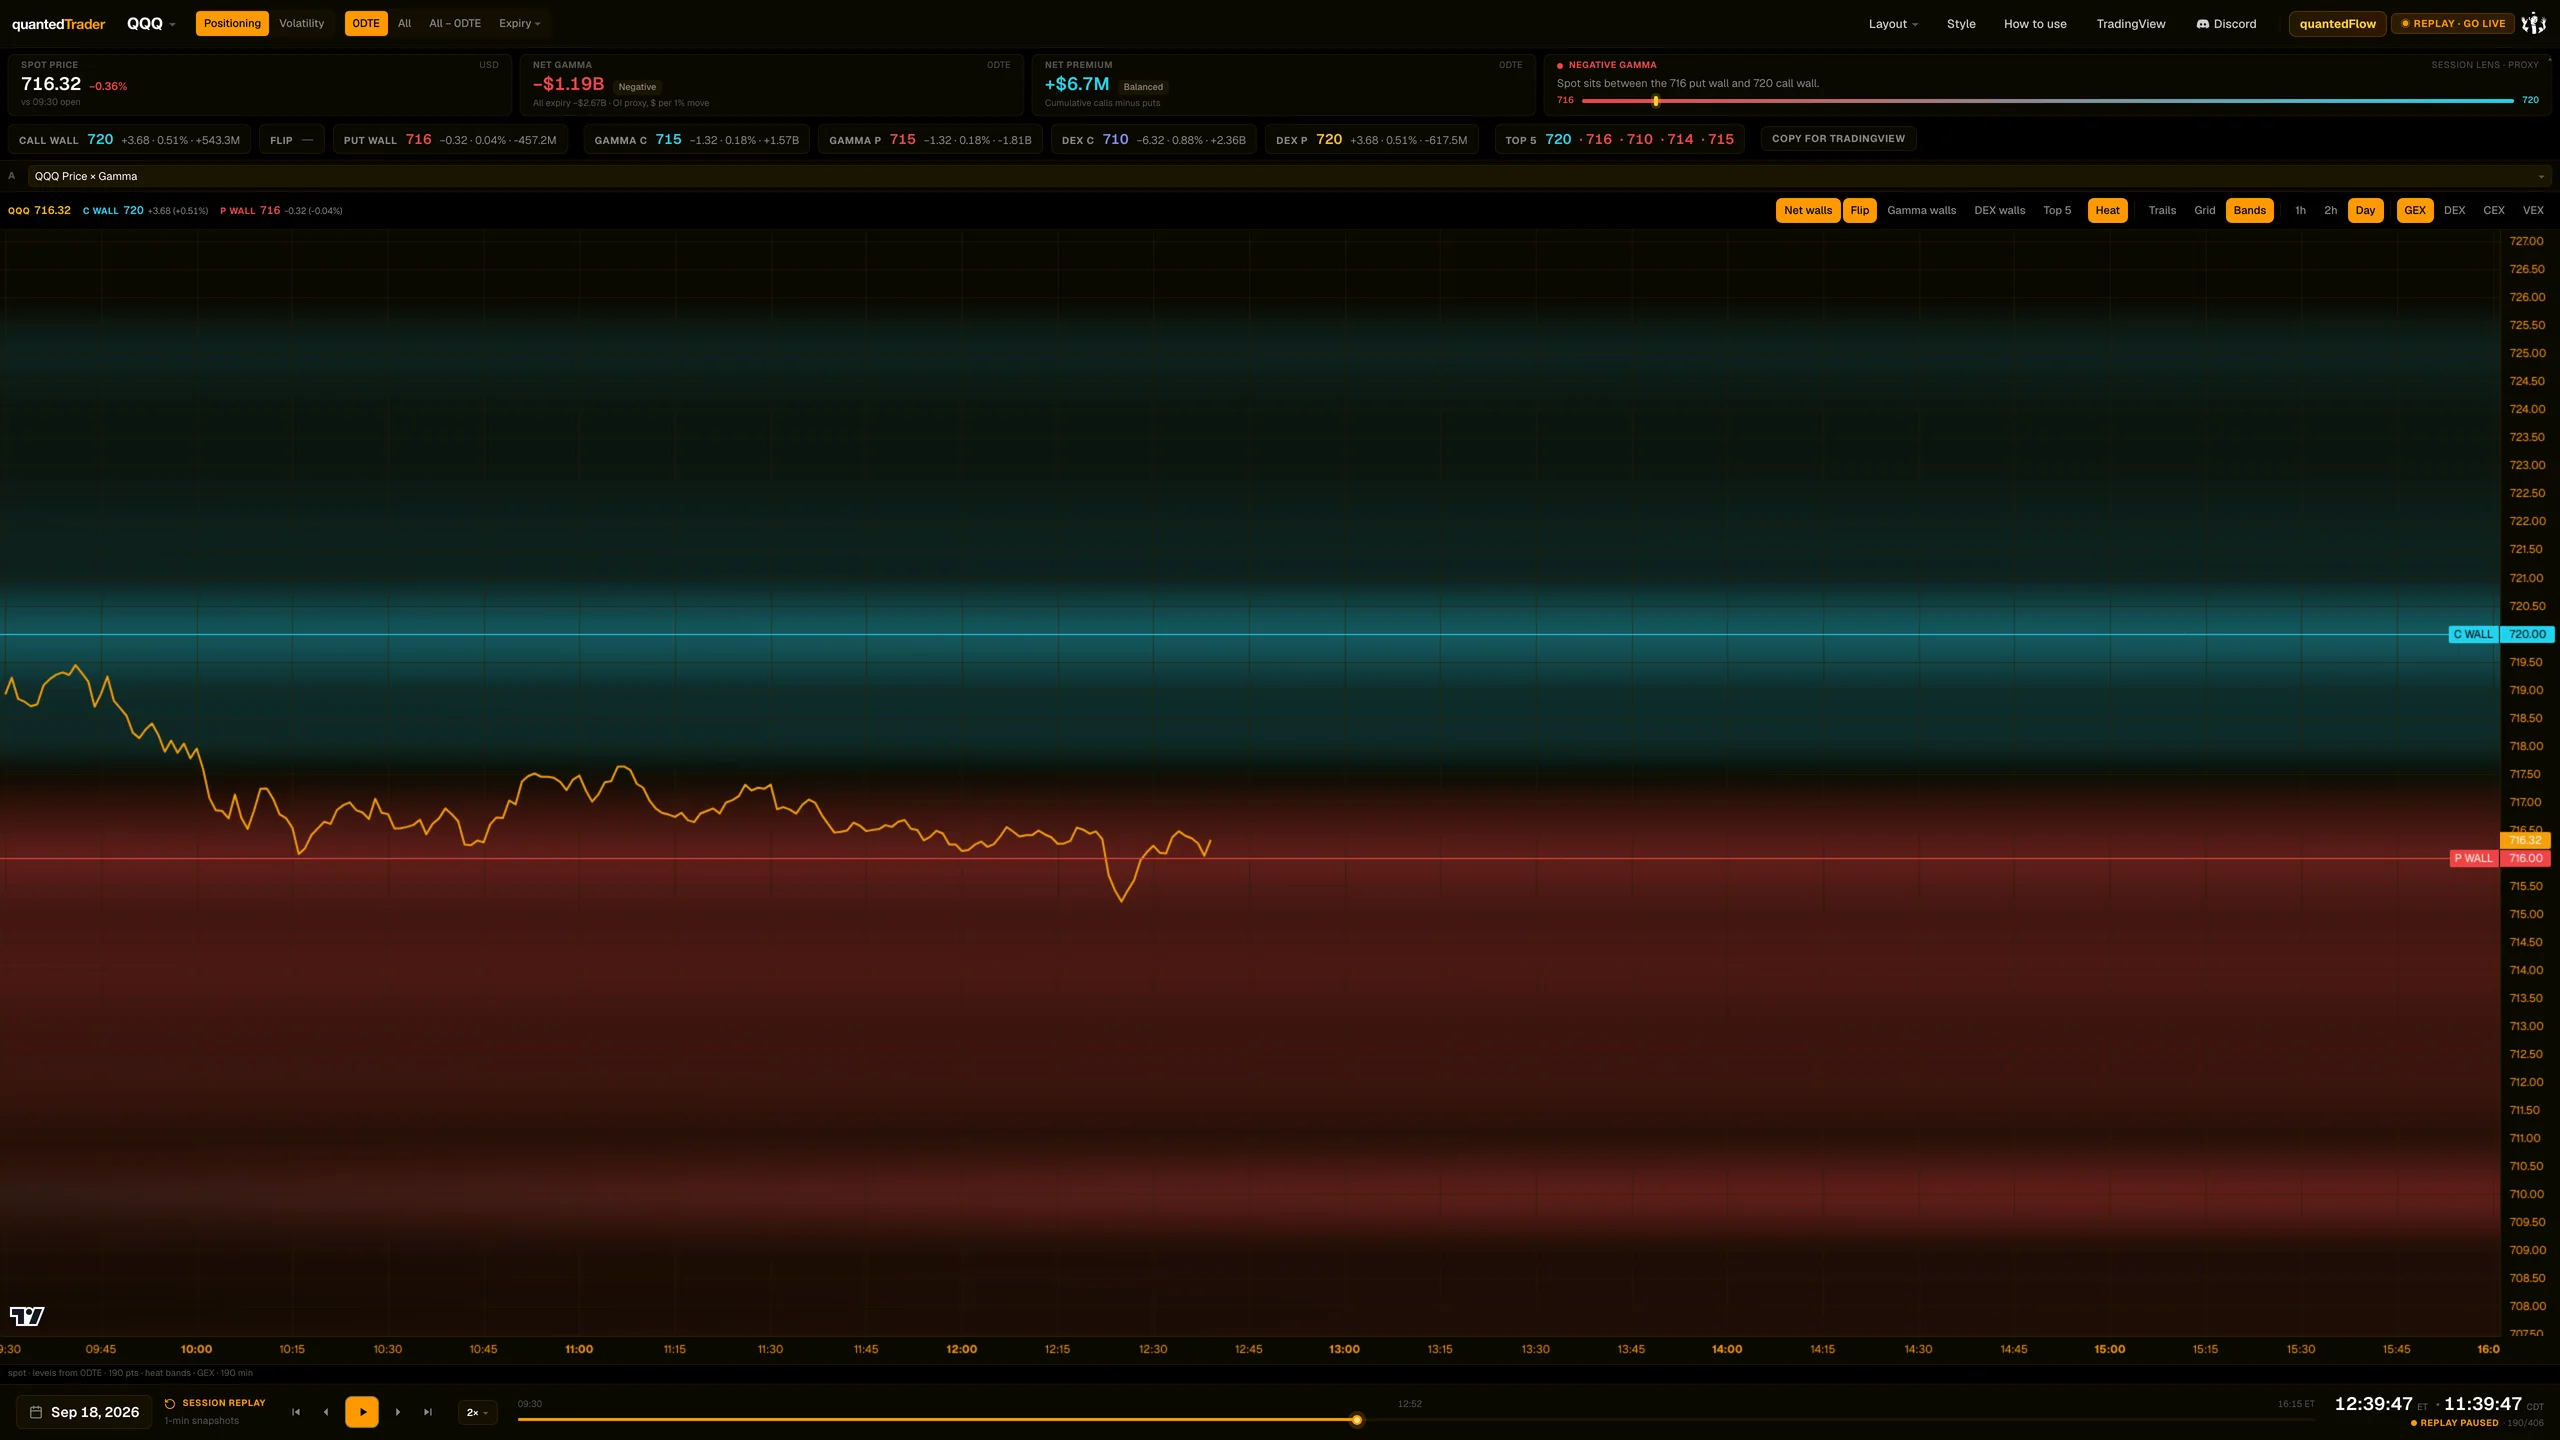
The spot line for regular hours, cut at the replay minute, with horizontal level lines (C WALL, P WALL, FLIP and optional others) and, on desktop, a heat layer showing where per-strike exposure sat through the session.
What it is built from
The session's price with gamma levels and per-strike exposure. Computed from data consolidated across every US options exchange: open interest and volume.
Reading
How to read it
- C WALL / P WALL (solid) are the net-gamma walls; FLIP (dashed grey) is the zero-cross.
- GAMMA C / GAMMA P (dashed) and DEX C / DEX P (dotted) are optional; T1-T5 are the five largest strikes.
- Trails show how the biggest strikes migrated; Grid and Bands show the whole strike field.
- Heat colour is scaled to the window on screen: pick 1h, 2h or Day to set it.
Controls
What each control does
| Control | Options | What it changes |
|---|---|---|
| Level toggles | Net walls (on), Flip (on), Gamma walls, DEX walls, Top 5 | Which level lines are drawn. |
| Heat | on / off | Shows the strike heat layer. |
| Heat style | Trails, Grid, Bands | How heat is drawn. |
| Heat window | 1h, 2h, Day | How much history the heat covers and is scaled to. |
| Heat metric | GEX, DEX, CEX, VEX | Which exposure the heat shows. |
Read it with
- Strike Profile — the ladder is one minute of this heat
- Session strip (Spot price, Net gamma, Net premium, Session lens, levels row) — same levels as chips
Good to know
- Open interest updates overnight, so intraday the levels move with price, time and implied volatility.
- Heat is drawn for the combined expiry views, on desktop.
A real session
See it happen
12:39 ET
QQQ 2026-09-18: low 716.32 at 12:39, then a close at the session high 721.34; read the low against the P WALL / FLIP lines.
13 slides
The walk-through, slide by slide
Slide 1 / 13
From the product
Real frames
Shot off the live product, nothing redrawn. Click the right side of a frame for the next one, the left side to go back.
Product frame 1 / 9
These pages describe what the displays show and what the data did on the sessions shown. They are not trading advice, and a past session is not a forecast of a future one.