Get started: pick your platforms, paste your key
Pick two platforms, get your key, three steps, leave everything on AUTO.
What it shows
Three steps. Subscribe and pick two: $99 a month, choose the two platforms included with your plan, and your key is issued the moment checkout completes. Download and install: each platform has a step-by-step guide. Paste the key: enter it in the add-on's connection settings, leave Source and Conversion on AUTO, and the Profile appears on your chart within seconds.
What it is built from
One account, one key, every platform. The key connects each add-on to the same data: on ES and MES, licensed CBOE one-minute data with market-maker positioning; on the other families, computed from data consolidated across every US options exchange: open interest and volume.
Reading
How to read it
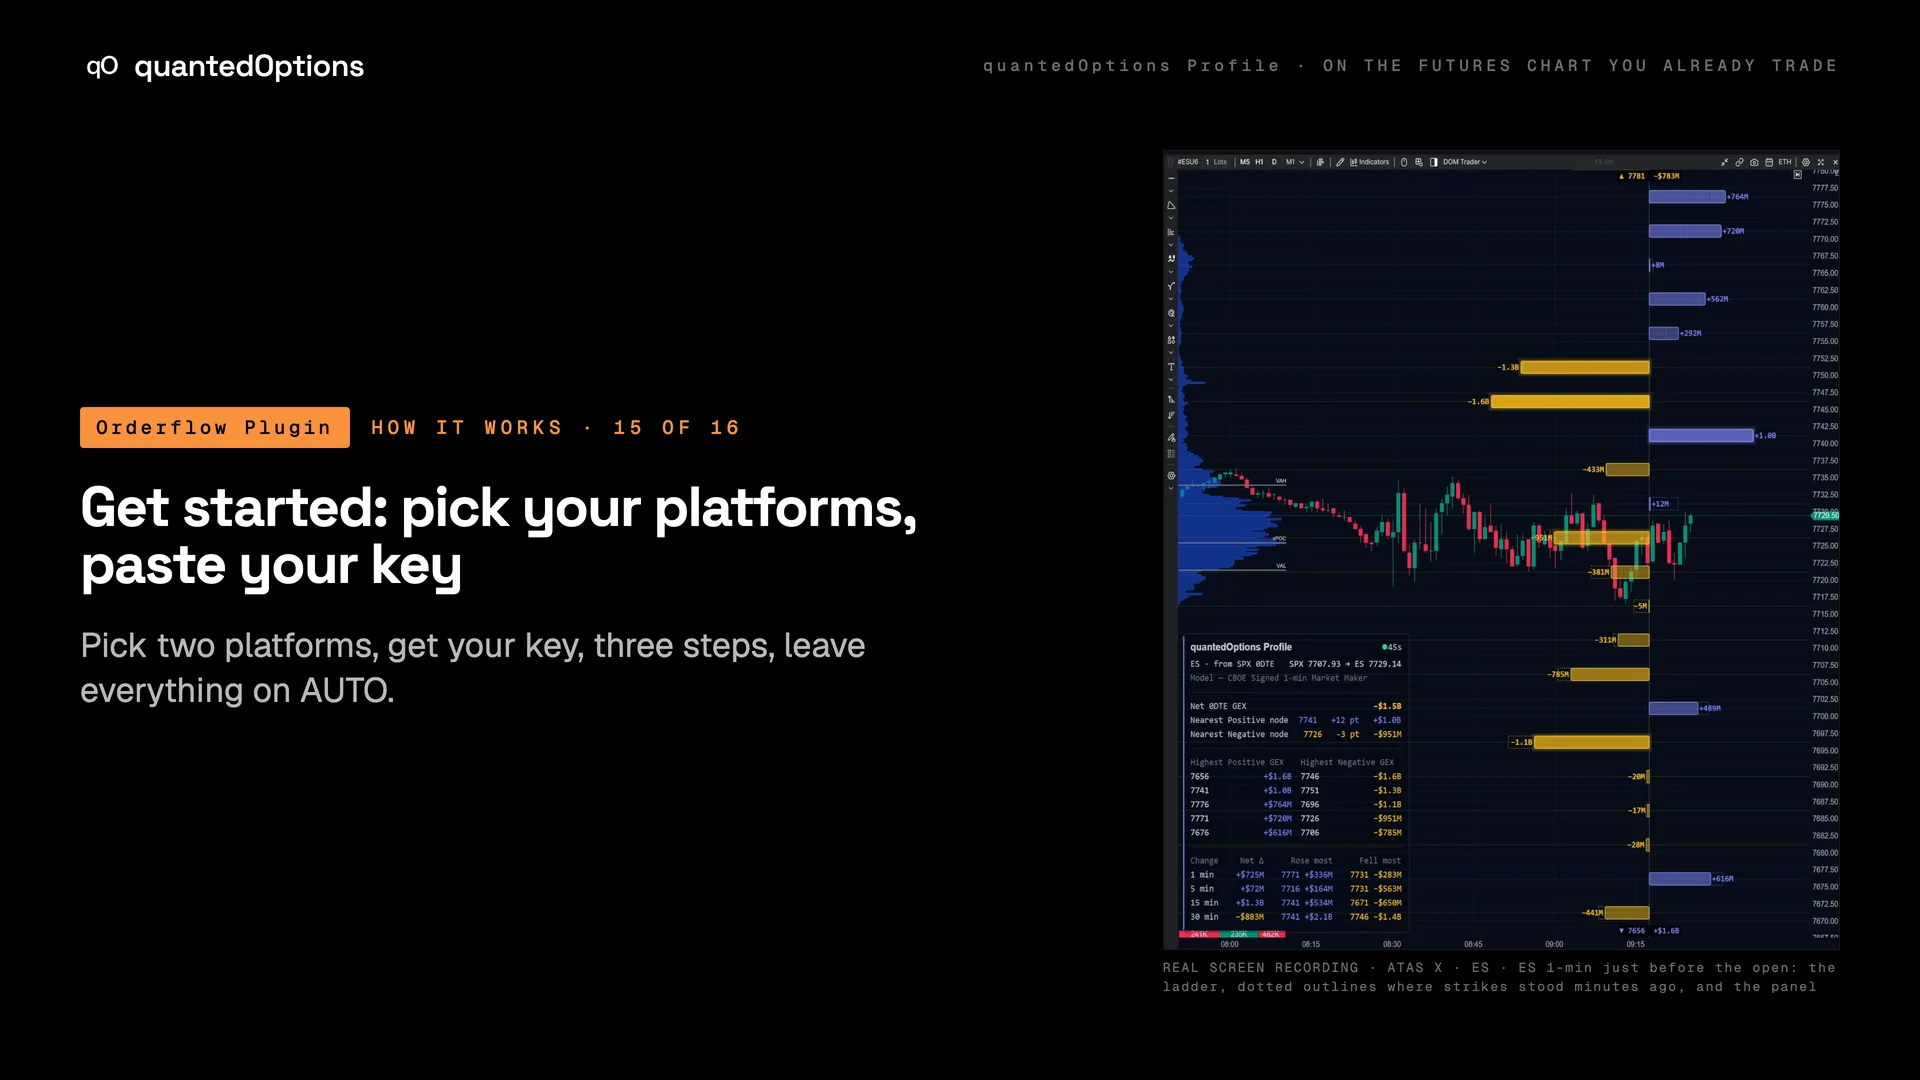
- It works when you see a ladder of bars on the right of the chart, one per strike, and a small panel in the bottom-left corner.
- The panel's first line names the chart and the source, 'ES · from SPX 0DTE 08-19', then the prices, 'SPX 6480.25 → ES 6512.00'.
- The dot in the panel header is green when the data is fresh.
- Your plugin page lists your key, your platforms and their downloads, and the TradingView add-on.
Settings
What each setting does
| Setting | Options | What it changes |
|---|---|---|
| API key | your qo_live_… key | Connects the add-on. Remembered on this machine. |
| Options underlying / Source ticker | AUTO | Reads the chart symbol and picks the matching data. |
| Price conversion / Conversion | AUTO | Places the Profile at your chart's prices. |
| Book | Today's / nearest expiry (default), All expiries | The 0DTE book, or every listed expiry in one profile. |
Read it with
- Instruments: one key, every family — eS from SPX with CBOE signed market-maker data; every other family its own levels
- The data panel — the regime, the nearest nodes, the top strikes and what changed, in one corner
- TradingView: quantedOptions Levels — call and put walls, the gamma flip and the top nodes on TradingView
Good to know
- Any other platform adds to the same subscription for $9 a month, at checkout or later; quantedUltra includes all six.
- One key runs every platform on your plan, on up to three of your own machines at once, with as many charts as you like.
- The settings are the same on every platform; the labels differ by a word.
On a real chart
See it happen
A first ES chart after the key is pasted: the ladder on the right, the panel bottom-left reading 'ES · from SPX 0DTE' with the date, the price pair under it, and a green dot.
11 slides
The walk-through, slide by slide
Slide 1 / 11
These pages describe what the displays show and what the data did on the sessions shown. They are not trading advice, and a past session is not a forecast of a future one.