The data panel
The regime, the nearest nodes, the top strikes and what changed, in one corner.
What it shows
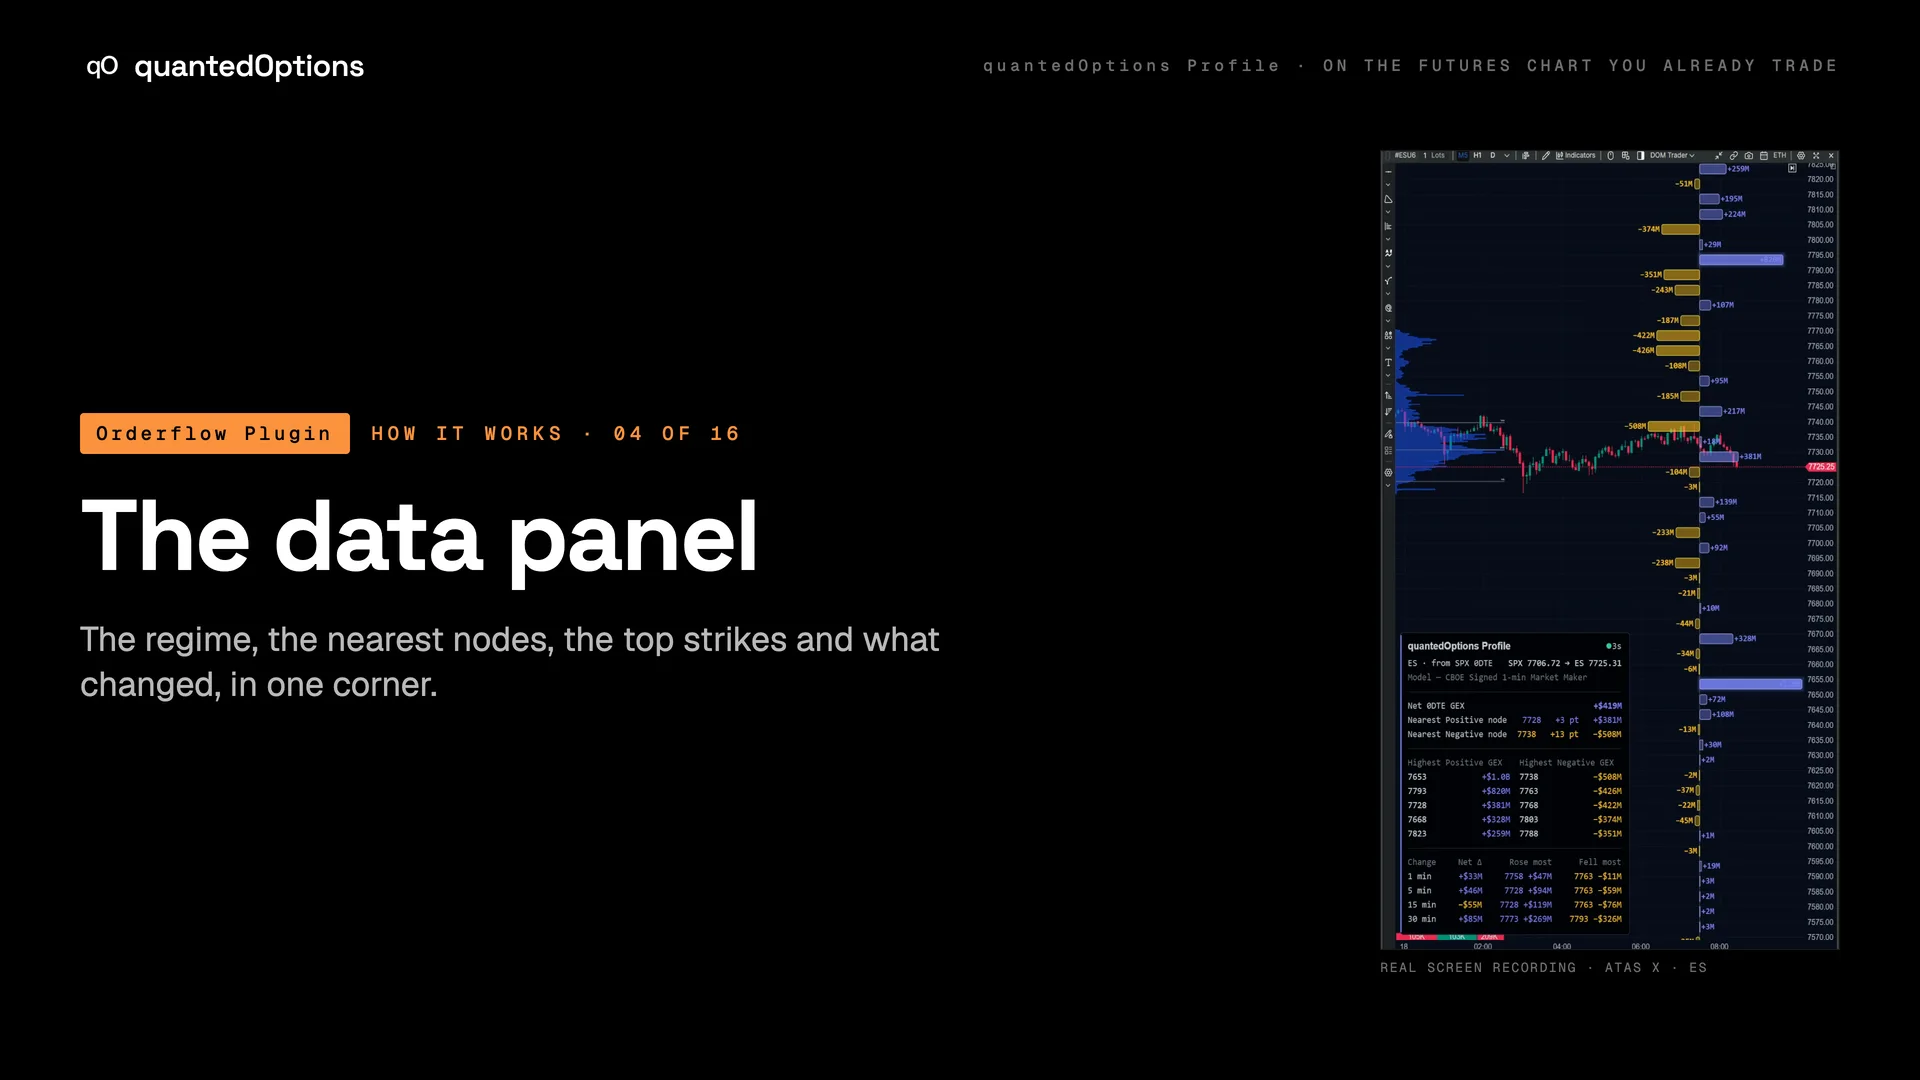
A small table in a chart corner. Its first line names the chart and the source ('ES · from SPX 0DTE 09-03') and then the prices ('SPX 6480.25 → ES 6512.00'), with the model label and a freshness dot. Under it: 'Net 0DTE GEX', the 'Nearest + node' and 'Nearest − node' with strike, points away, what that is worth per contract and size, the 'Highest Positive GEX' and 'Highest Negative GEX' lists of five strikes each, and the Change rows at 1, 5, 15 and 30 minutes.
What it is built from
The same book as the ladder, as numbers. On ES and MES: licensed CBOE one-minute data with market-maker positioning, from SPX, computed and delivered every minute. On the other families: computed from data consolidated across every US options exchange: open interest and volume.
Reading
How to read it
- 'Net 0DTE GEX' is the regime: positive means market makers are net long gamma and price tends to be held; negative means moves travel faster and farther.
- A nearest-node row reads 'strike · points away · dollars per contract · size': '7725.25 +19.75 pt $987.50 +$2.0B'.
- The Change rows show how the book moved over the last 1, 5, 15 and 30 minutes: a node building or coming off shows here first.
- The model label names the data on screen: 'CBOE Signed 1-min Market Maker' on ES and MES, 'Open-Interest' on the other families.
- The dot in the header is the freshness indicator: green = fresh, amber = a few minutes old, red = stale.
Settings
What each setting does
| Setting | Options | What it changes |
|---|---|---|
| Data panel corner | Bottom-left, Top-left, Bottom-right, Top-right (default Bottom-left; NinjaTrader Top-left) | Which chart corner the panel sits in. |
| Data panel style | Dark, Light | Dark card, or a light card with dark text for light chart backgrounds. |
| Data panel background opacity / text size | percent; px | How solid the backing is and how large the type is. |
| Data panel: show nearest nodes | on / off (default on) | The nearest positive and negative node: strike, points away, what that is worth per contract, size. |
| Data panel: show top strikes | on / off (default on) | The five largest positive and the five largest negative strikes. |
| Data panel: show change windows | on / off (default on) | The Change rows. |
| Change windows | 1 min, 5 min, 15 min, 30 min (default on); Since open, Since premarket | Each ticked window is a row in the panel; the first one also drives the hollow comparison bars and the outlines. |
Read it with
- Gamma nodes at the strikes — the panel's rows are the ladder's bars as numbers
- Cumulative Net Gamma — the dashboard's regime line; 'Net 0DTE GEX' is that reading on your chart
- Gamma Flow By Strike — the Change rows through time, strike by strike
Good to know
- Distance is printed in dollars as well as points: what one contract of the future you are trading makes from here to the node.
- Outside market hours the last data is held and the dot stays green.
- After the roll to a new expiry the Change rows read 'warming' while each window fills.
On a real chart
See it happen
ES on 2026-09-03, the opening minutes. The panel reads 'ES · from SPX 0DTE 09-03' and 'SPX 7707.96 → ES 7717.15', with the model line 'CBOE Signed 1-min Market Maker'. Net 0DTE GEX is +$4.7B. The nearest positive node, 7724.25 at +$2.1B, sits 7 points above price and also leads Highest Positive GEX; the nearest negative node, 7719.25, is 2 points away. The Change row names the strike that rose most and the one that fell most in the last minute.
11 slides
The walk-through, slide by slide
Slide 1 / 11
These pages describe what the displays show and what the data did on the sessions shown. They are not trading advice, and a past session is not a forecast of a future one.