Read it live: the Profile through a session
Regime, nodes, band, change: the same reading order from the open to the roll.
What it shows
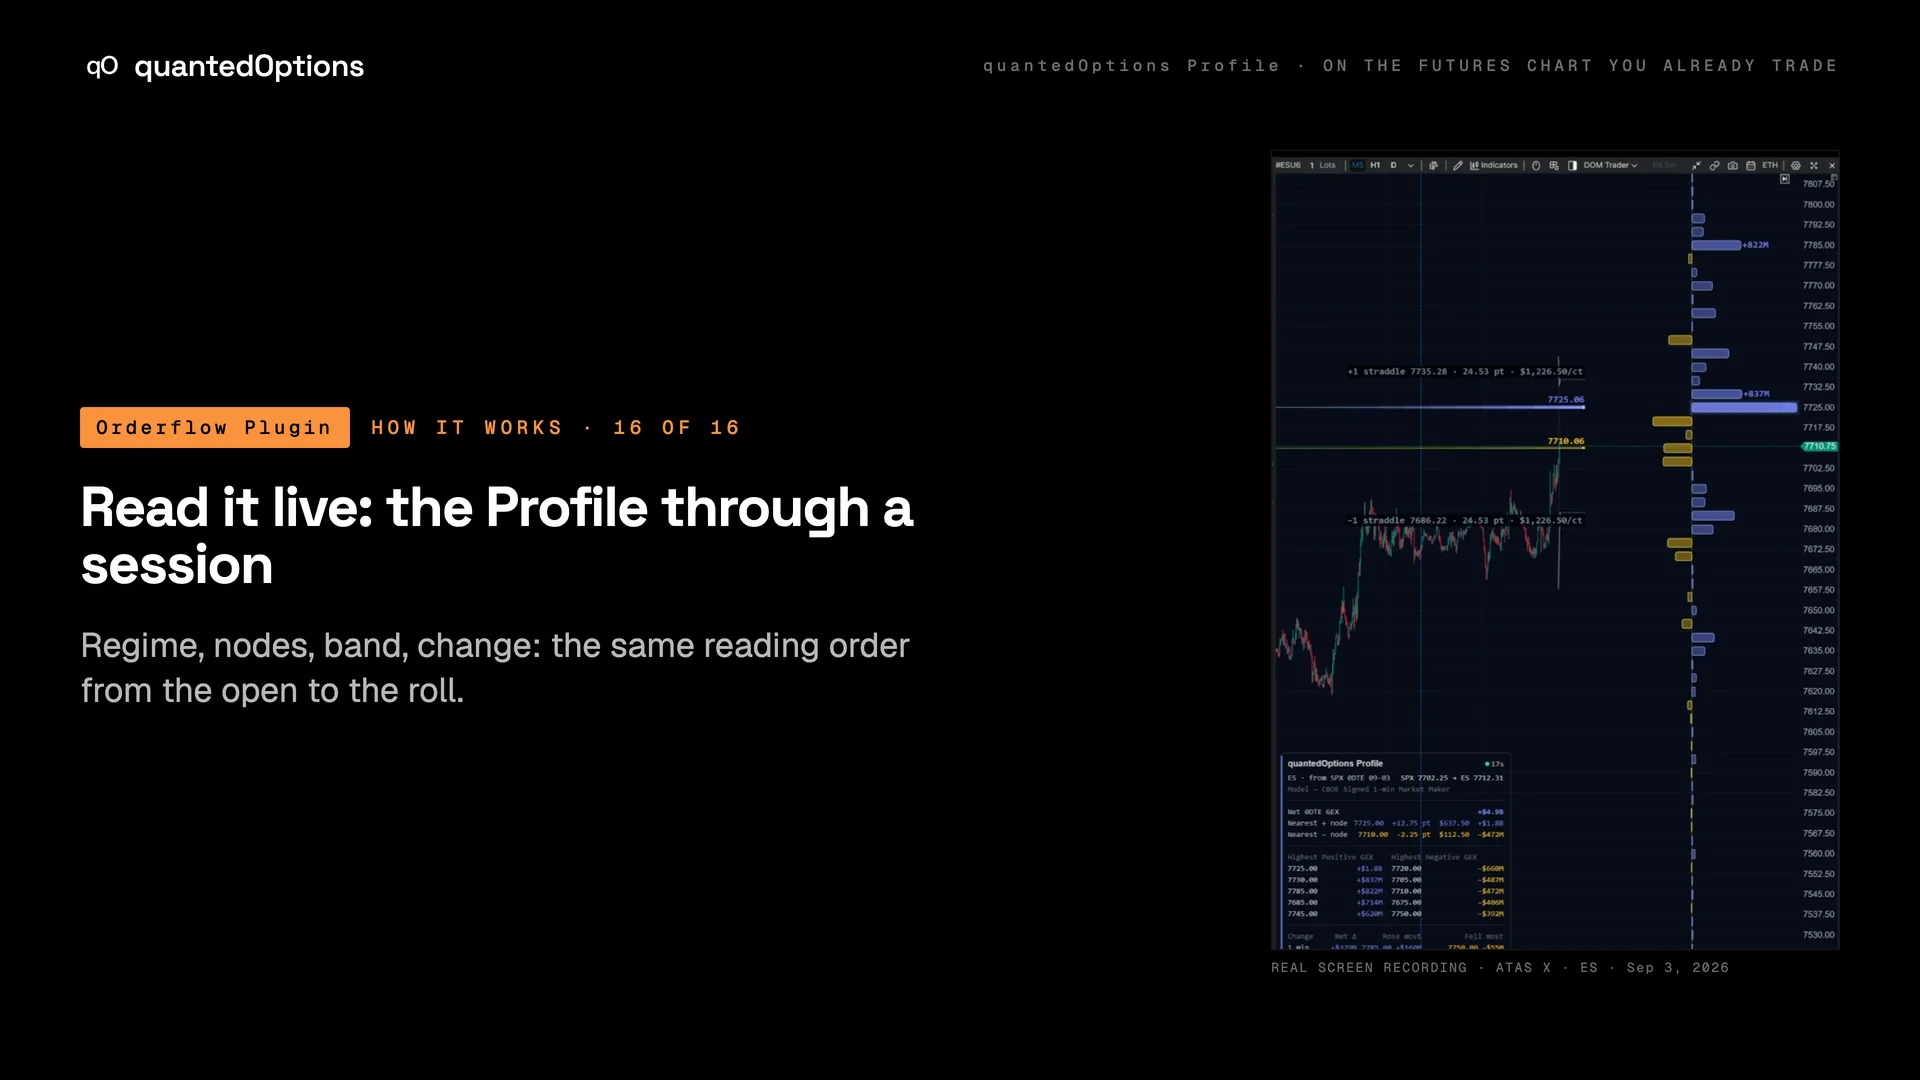
How the Profile reads through a real trading day, on the ES chart. The regime in the panel, the nearest node each side of price, the straddle band, and the Change rows and hollow outlines that show positioning building or coming off. Every reading below is tied to a session in the case-study library, where the dashboard shows the same minute.
What it is built from
ES footage from the case-study sessions, with licensed CBOE one-minute data with market-maker positioning, from SPX, placed at ES prices.
Reading
How to read it
- At the open: 'Net 0DTE GEX' for the regime, then the nearest + and − node either side of price and the band edges.
- Through the morning: the Change rows and the hollow outlines show a node building. On Sep 14 the floor built at ES 7660 while price fell toward it, and the low printed two points above it.
- At a node: a positive node is where price slows or stops. On Sep 8 one node, SPX 7700 at ES 7704.50, capped price for 4 hours 40 minutes.
- When a node drains its hold goes with it: on Sep 8 price left within five minutes of the drain.
- Into the close and after it: the 0DTE nodes grow as expiry nears, then the Profile rolls to the next expiry for the overnight session.
Settings
What each setting does
| Setting | Options | What it changes |
|---|---|---|
| Change windows | 1 min, 5 min, 15 min, 30 min; Since open, Since premarket | Which windows the panel shows; the first one drives the hollow bars and outlines. |
| Hollow comparison bars / Outline the 3 strikes that changed most | on / off each | Puts the change on the ladder itself. |
| Heatmap | Nearest + and - node, Top 3 each side, Top 5 each side | Carries the nodes you are reading across the chart as bands. |
Read it with
- Premium Flow — a node building on the chart and the market-maker call line rising on the dashboard are the same event seen twice
- Cumulative Net Delta — the market maker's total dollar delta through the session, by expiry cohort
- Replay bar — replay any of these sessions minute by minute on the dashboard
- Day and night: the overnight session and the roll — live overnight; after the cash close it rolls to the next expiry
Good to know
- It describes what the display shows in these sessions. It is a reading order, the same one the dashboards use.
- On FOMC day, Sep 16, SPX 7500 sat on the ES chart at 7571.25 at 11:00 and 7568.25 at 15:27; the low came 7.77 SPX points above the strike.
On a real chart
See it happen
10:55 ET
Sep 14 on the ES chart. The floor: positive market-maker gamma at ES 7660, +$2.3B by 10:55, +$2.1B of it puts; the low prints two points above it. The reversal: gamma builds above price at ES 7685/7695 and price runs 25 points from 11:29 to 11:44. The stop: ES 7730, +$11.9B against −$6.1B at 7735.
11 slides
The walk-through, slide by slide
Slide 1 / 11
These pages describe what the displays show and what the data did on the sessions shown. They are not trading advice, and a past session is not a forecast of a future one.