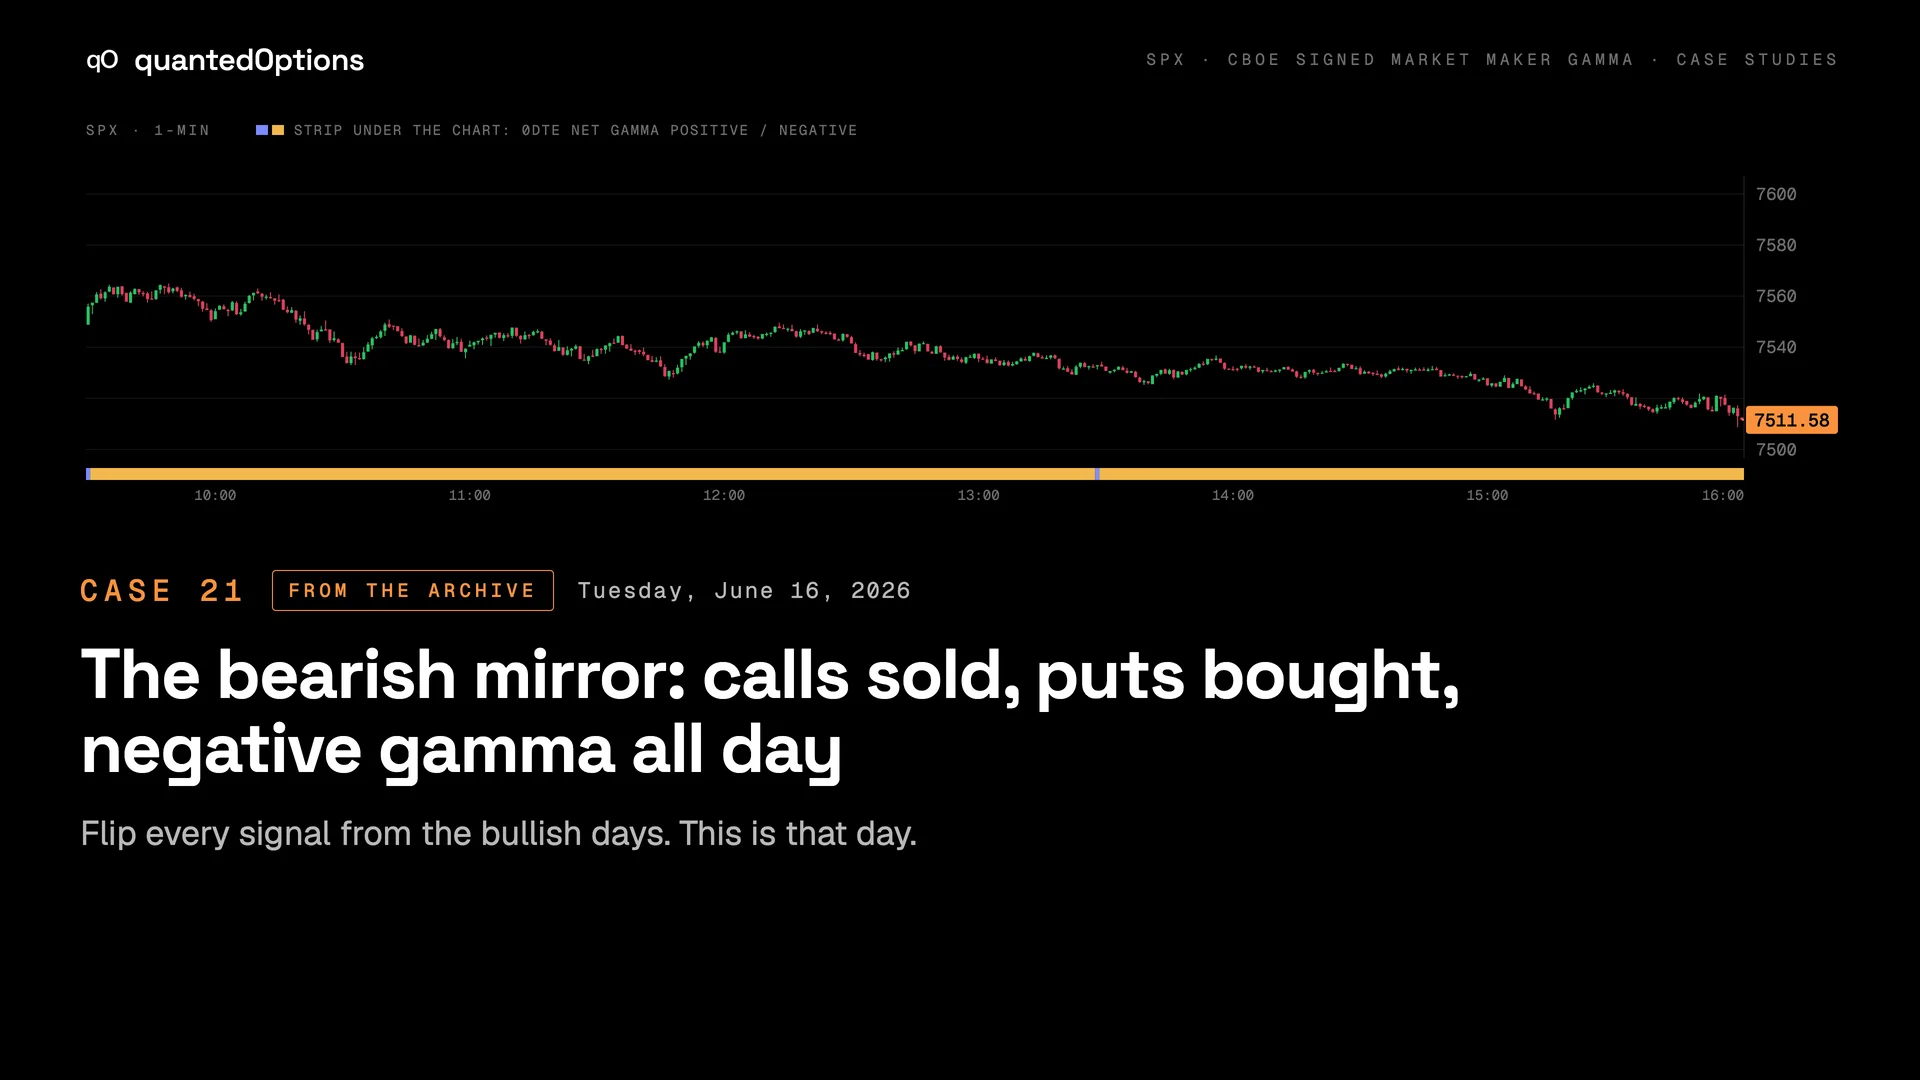
The bearish mirror: calls sold, puts bought, negative gamma all day
Flip every signal from the bullish days. This is that day.
- SPX open
- 7,548.78
- High
- 7,564.96
- Low
- 7,508.68
- Close
- 7,511.58
- 0DTE net gamma positive
- 1%
- All-expiry net gamma positive
- 73%
- VIX open → close
- 16.08 → 16.27
- VIX high
- 16.27
09:49 ET
15:59 ET
of the session's minutes
of the session's minutes
The VIX Tuesday
The story
- Tuesday before the June monthly VIX expiry and the Fed. 0DTE net gamma negative 99% of minutes.
- Calls sold all day (-$21M). Puts bought (+$10M). Net premium -$31M — the exact inverse of 06-29 and 09-03.
- VIX1D went 8.9 to 15.7 while VIX barely moved (15.9 to 16.3): the event being priced, a day early.
- On the VIX dashboard market makers were short about 215,000 calls in the expiring contract, with the largest strikes at 16 (negative) and 17 (positive). VIX closed between them.
- Then what: the low printed in the last minute and the close, 7511.58, was three points off it. Next session -104.
Minute by minute
The beats
09:49 ET
session high 7564.96; 0DTE near -$4.3B
11:00 ET
calls sold -$12.6M
14:00 ET
calls -$14.7M, puts +$9.8M; VIX1D 13.6 from 8.9
15:00 ET
0DTE -$6.4B; price 7525
15:59 ET
session low 7508.68 in the final minute; premium net -$30.7M
From the product
The dashboard at each beat
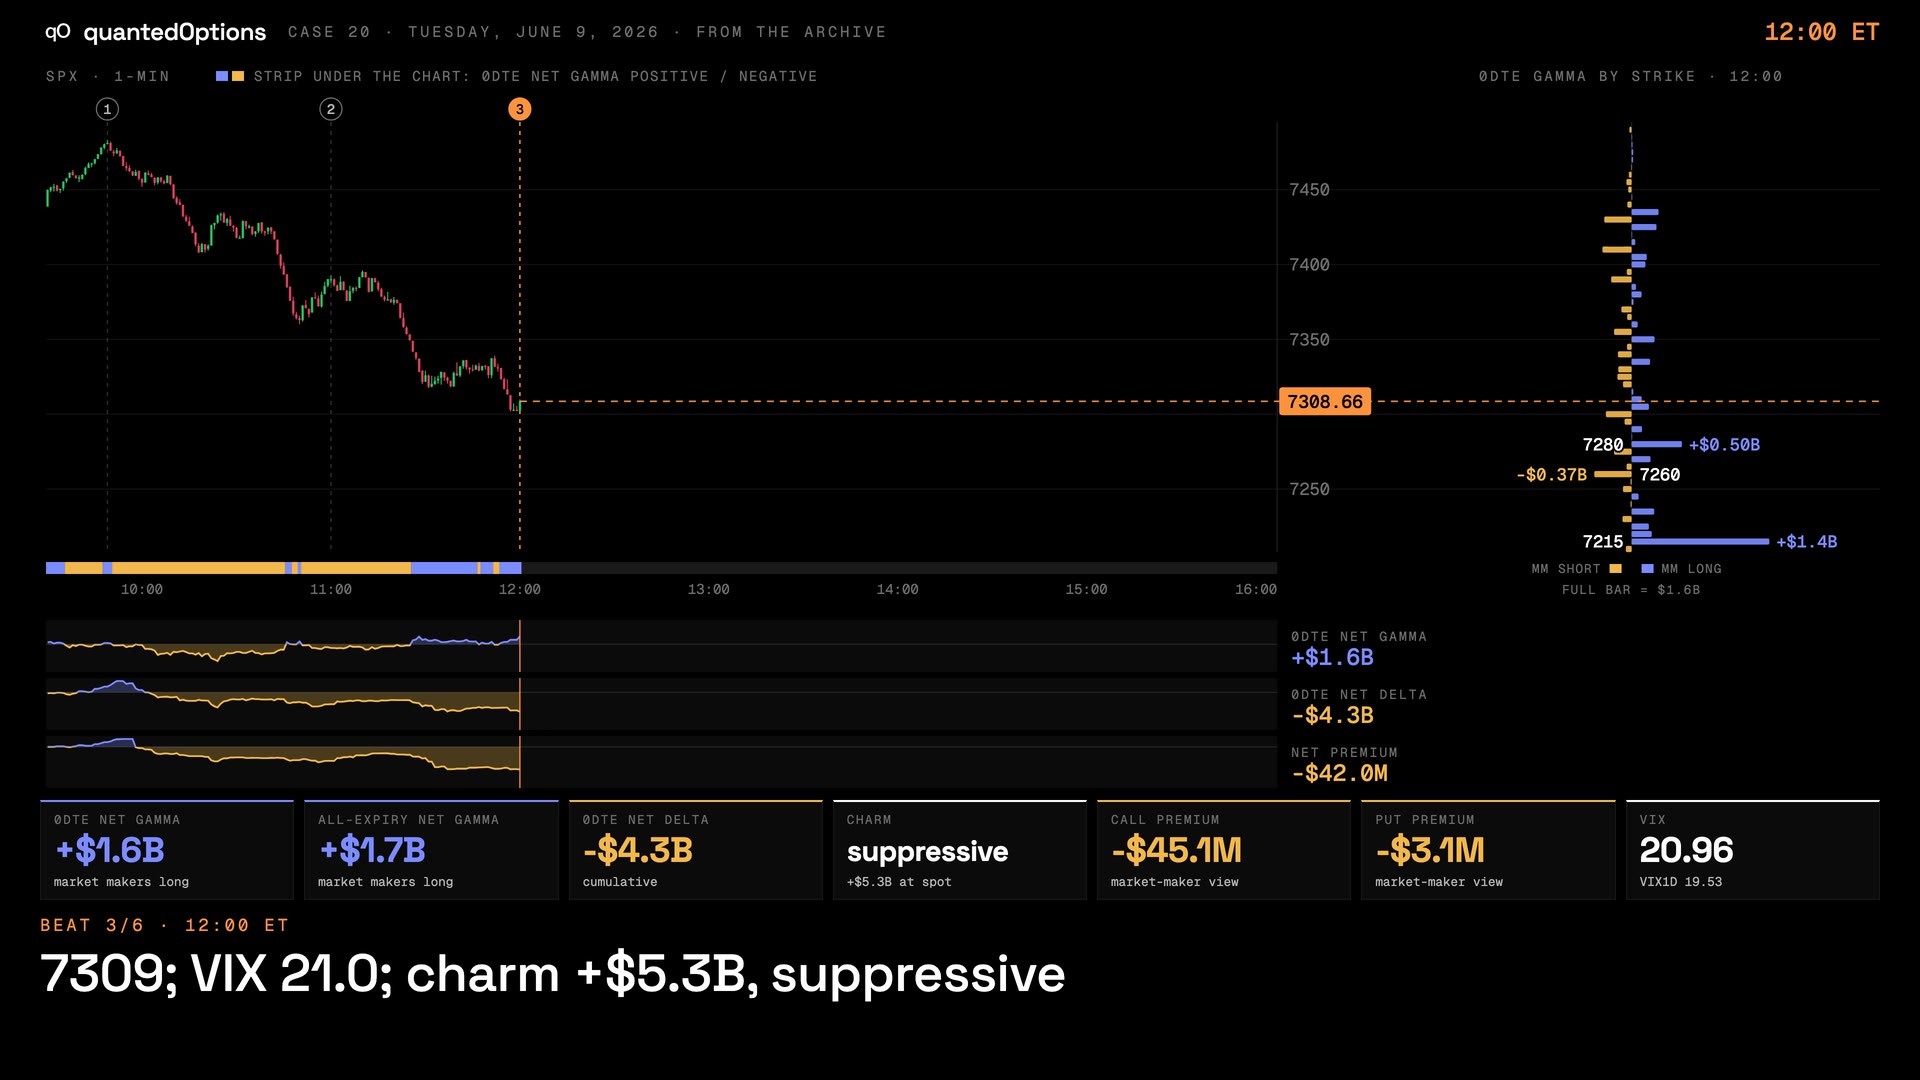
Premium Flow, Cumulative Net Delta and Gamma Flow By Strike on one screen, replayed to the minute. Real frames, nothing redrawn. Click the right of the frame to step to the next beat.
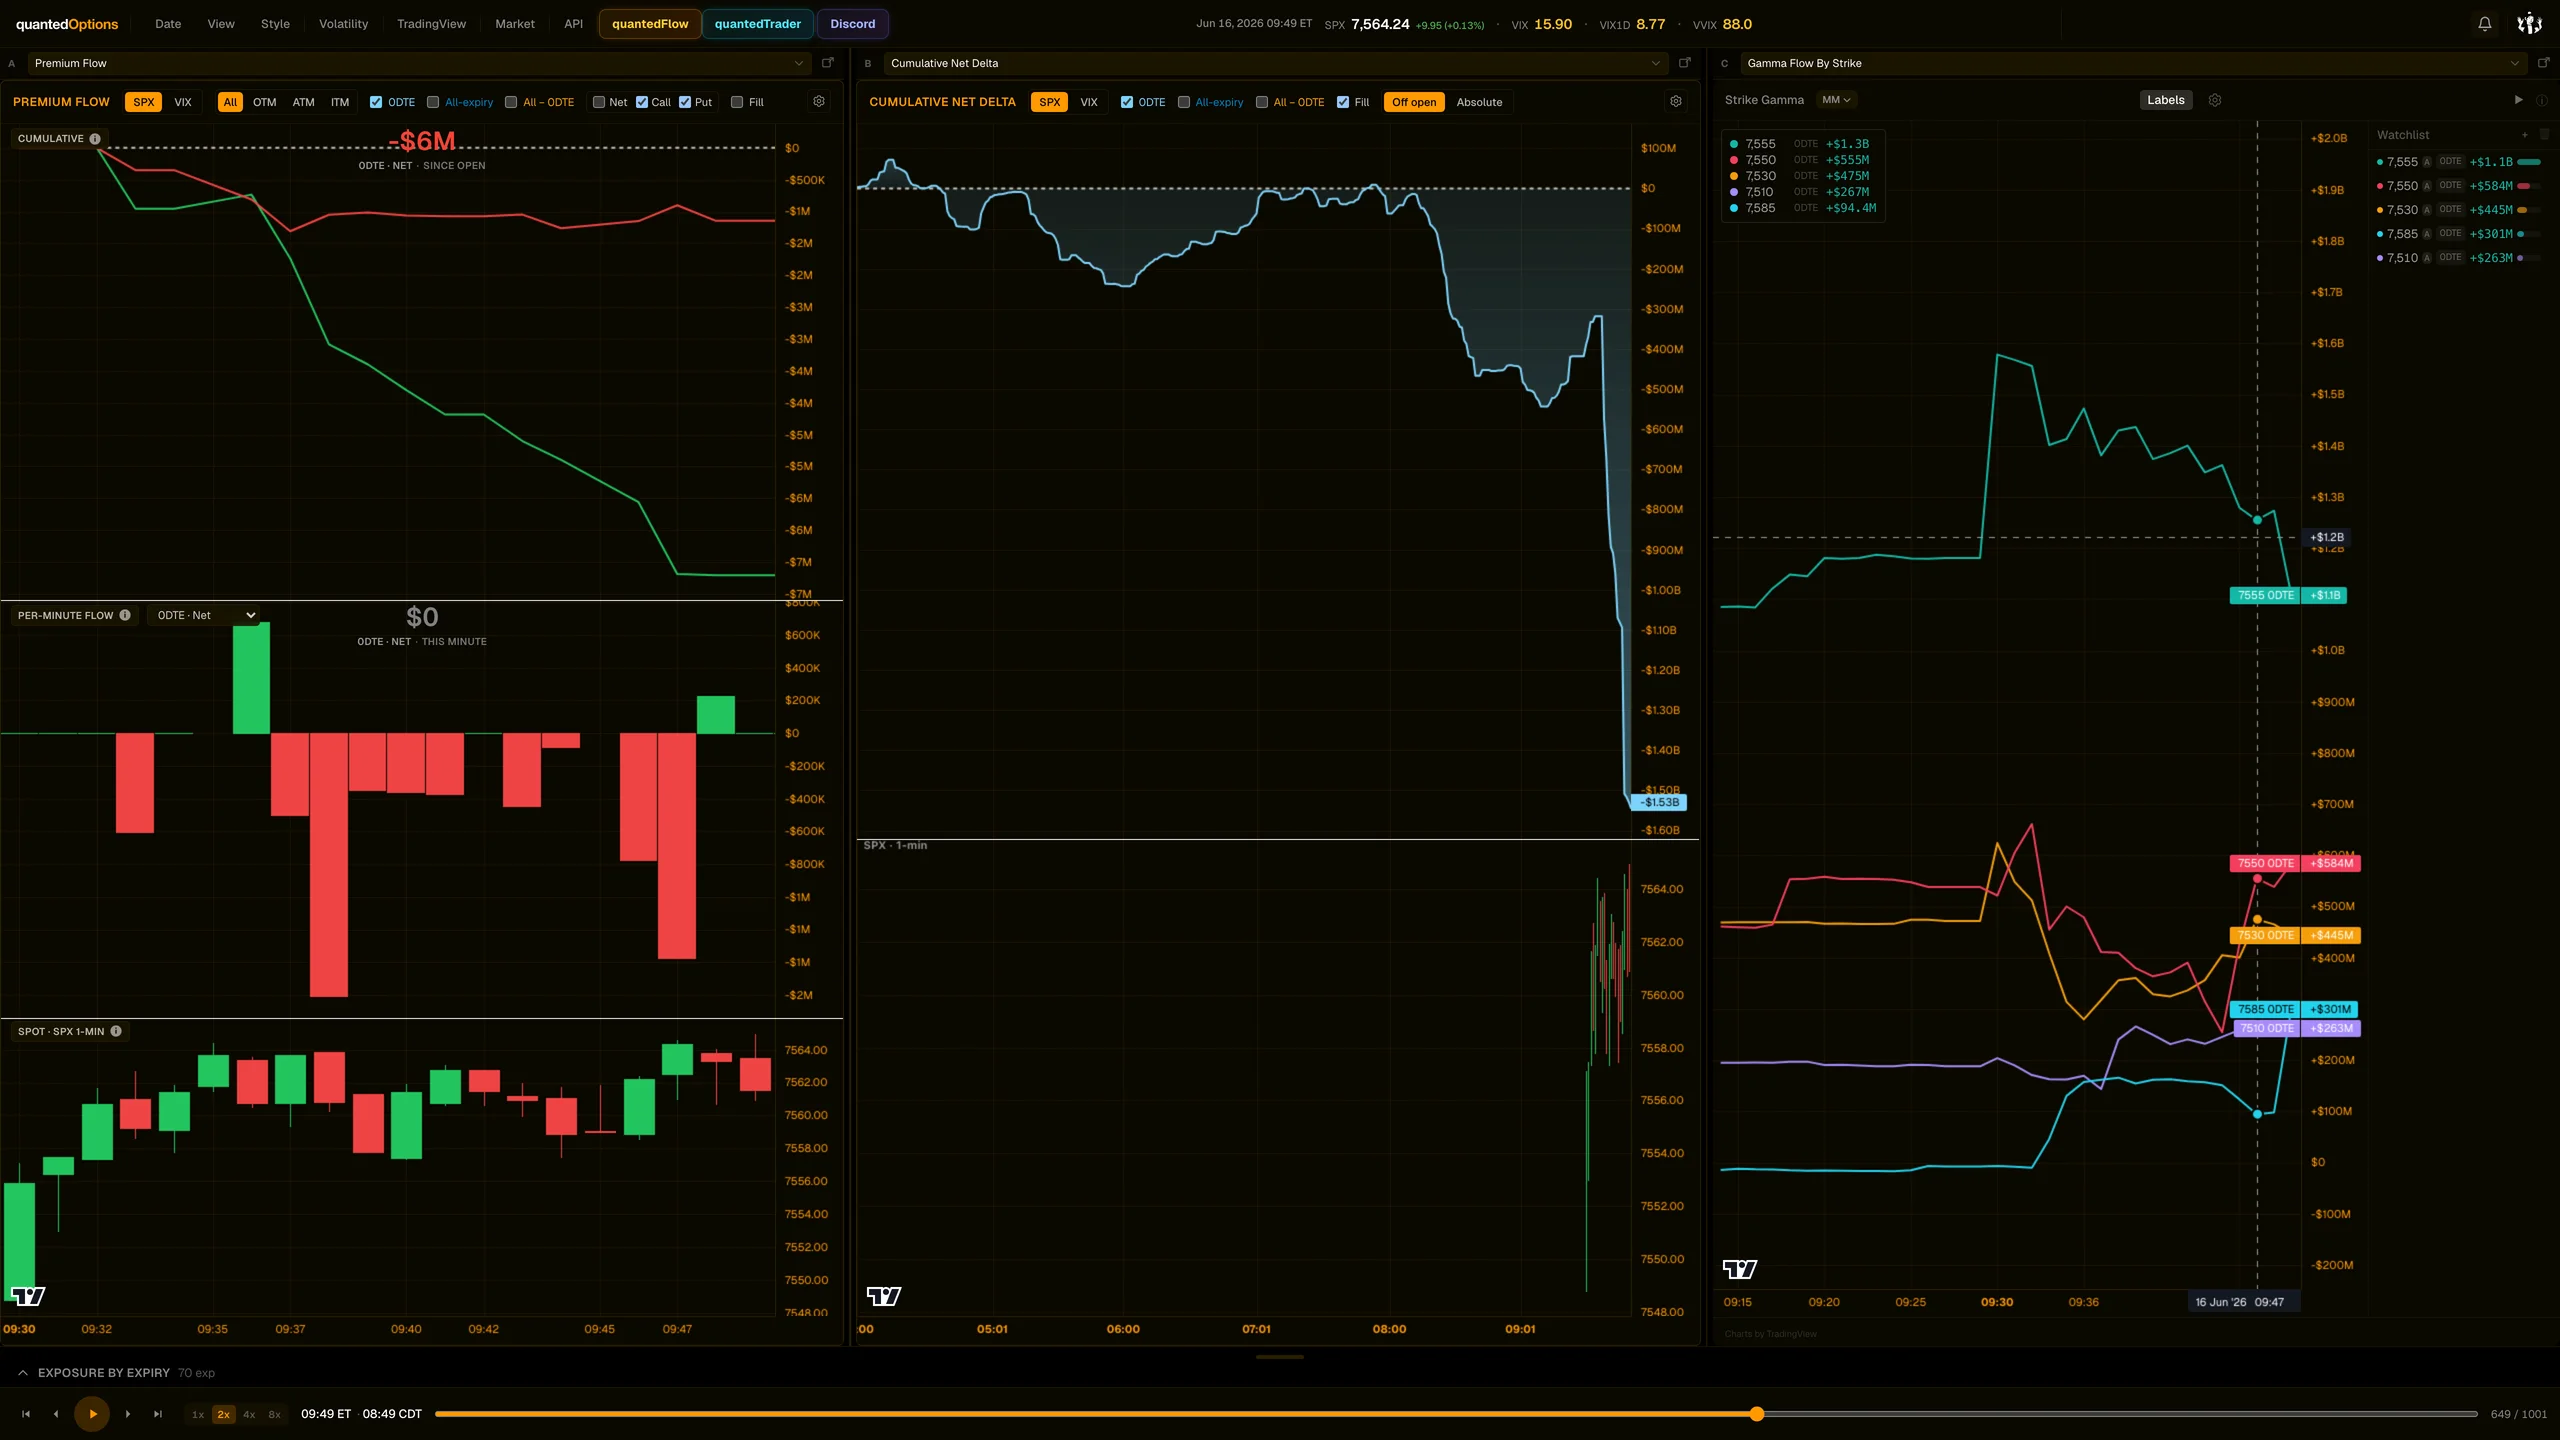
Dashboard frame 1 / 5
09:49 ET — Session high 7564.96; 0DTE near -$4.3B
More of this session
The short cut
The short cut
9 slides
The case, slide by slide
Slide 1 / 9
Same pattern
The VIX Tuesday
 1:11
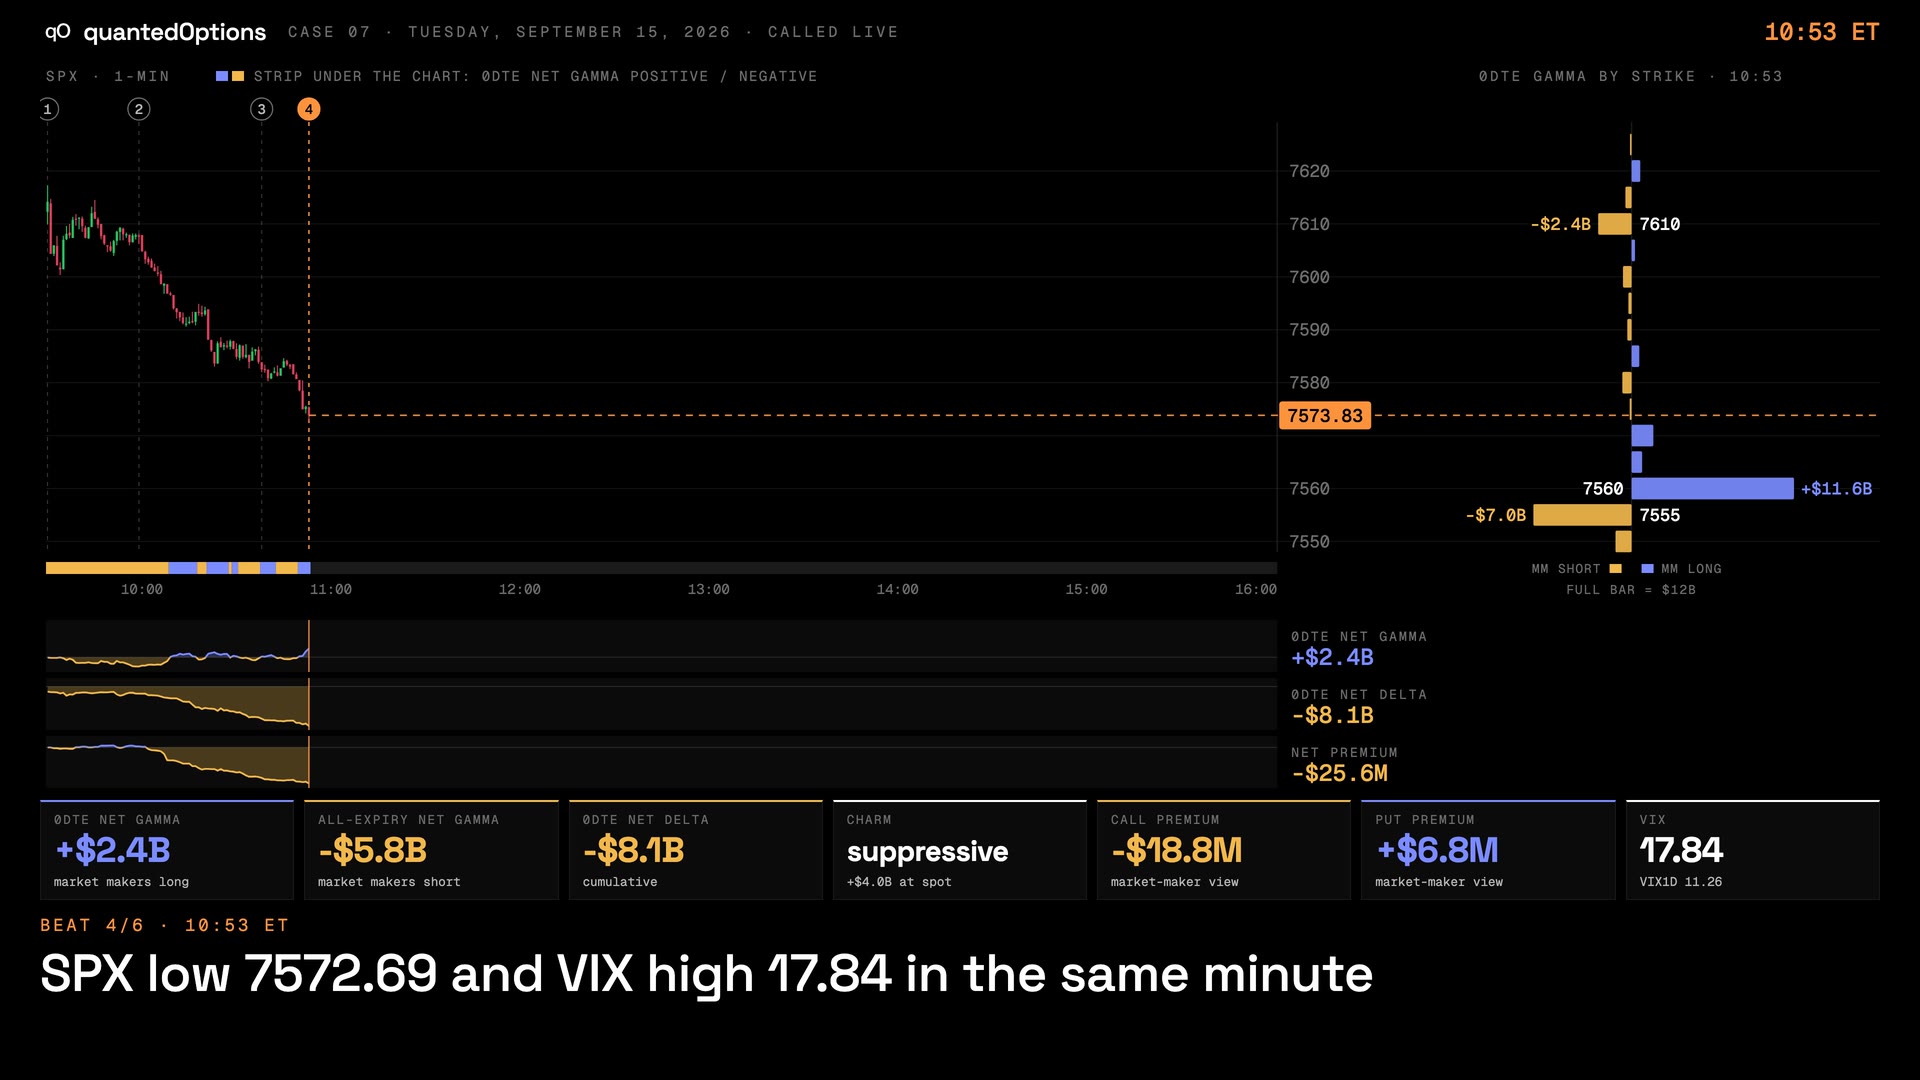
1:11The Tuesday before VIX expiry: the flow never confirmed, so no follow-through
Negative gamma, suppressive charm, price falling — and the put line never turned up.
The VIX Tuesday
 1:07
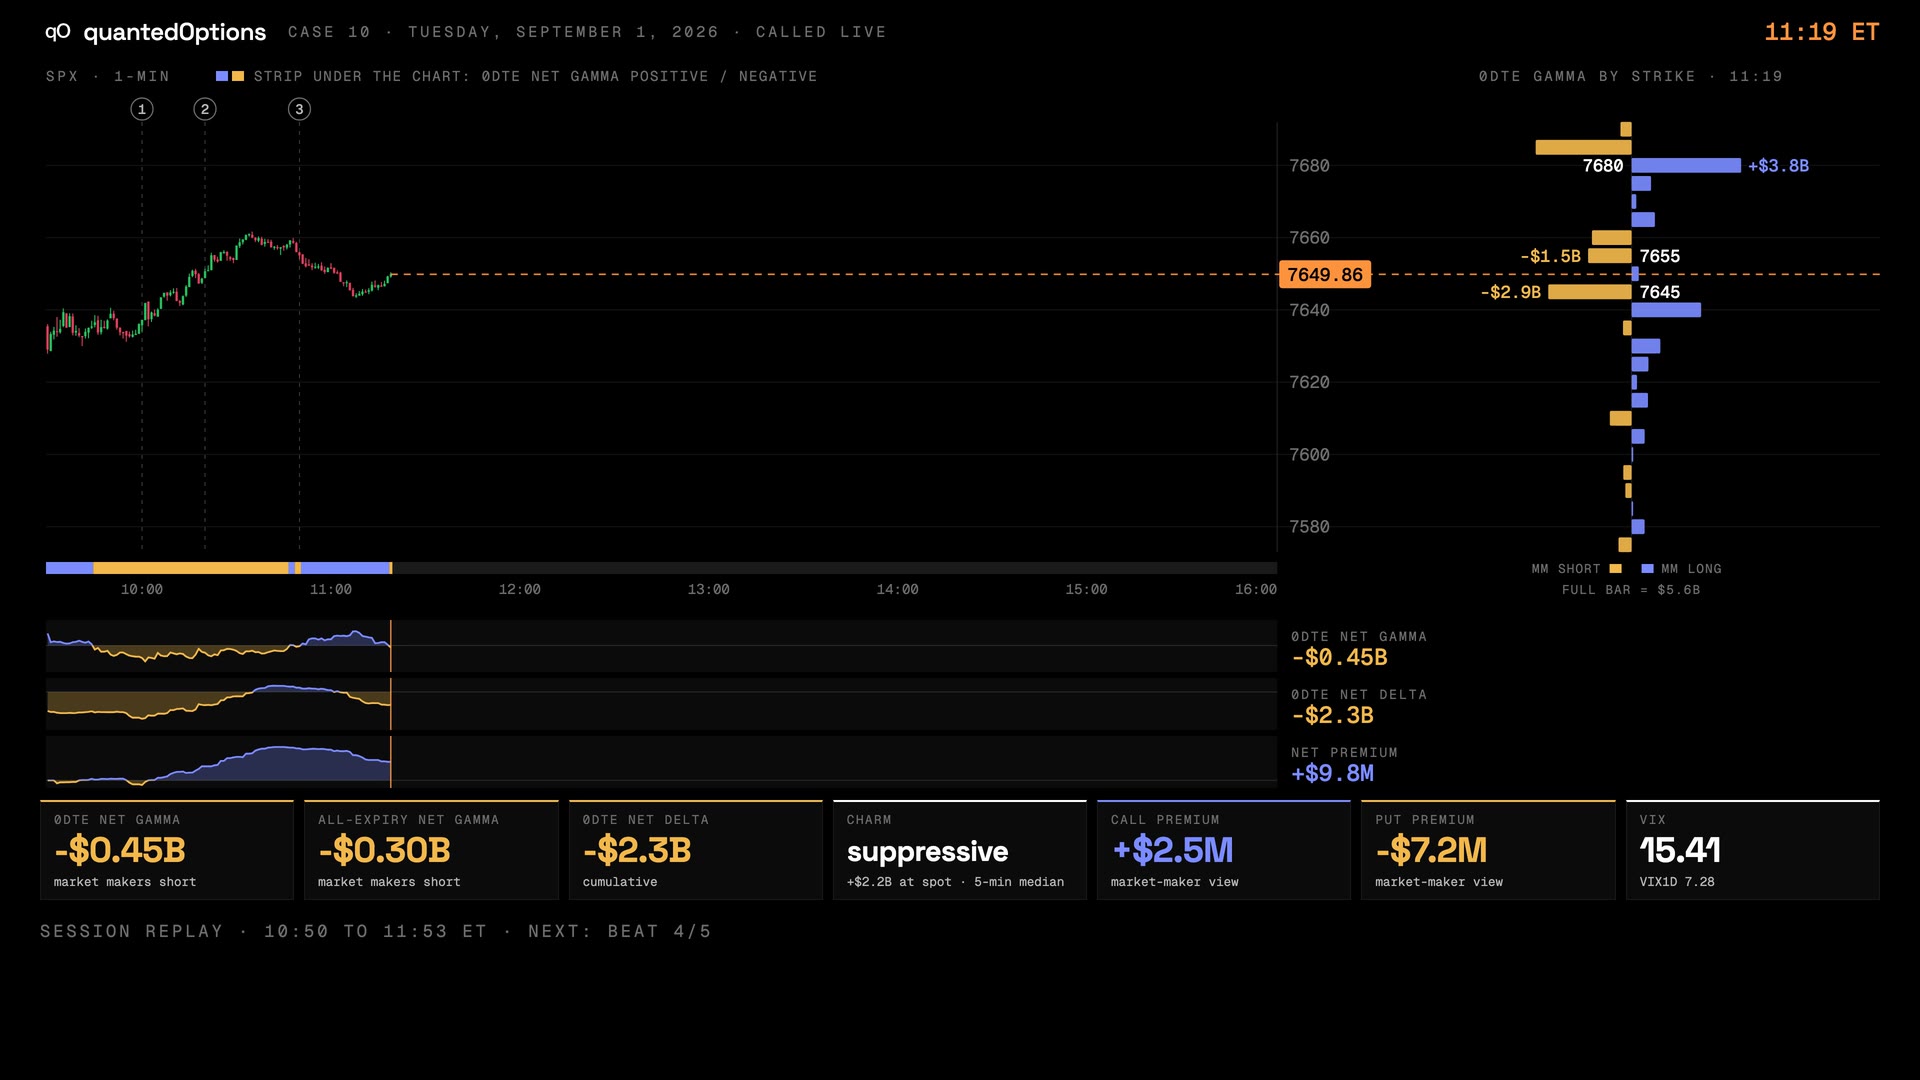
1:07Market is in negative gamma now: faster and farther, both ways
Up 34, then down 52. Same day, same regime.
The VIX Tuesday
 1:11
1:11VIX ran to the expiring contract's largest strike and turned — and so did SPX
Tuesday, the day before VIX expiry. VIX went from 17.6 to 23.3 in three hours.
The VIX Tuesday
These pages describe what the displays show and what the data did on the sessions shown. They are not trading advice, and a past session is not a forecast of a future one.